
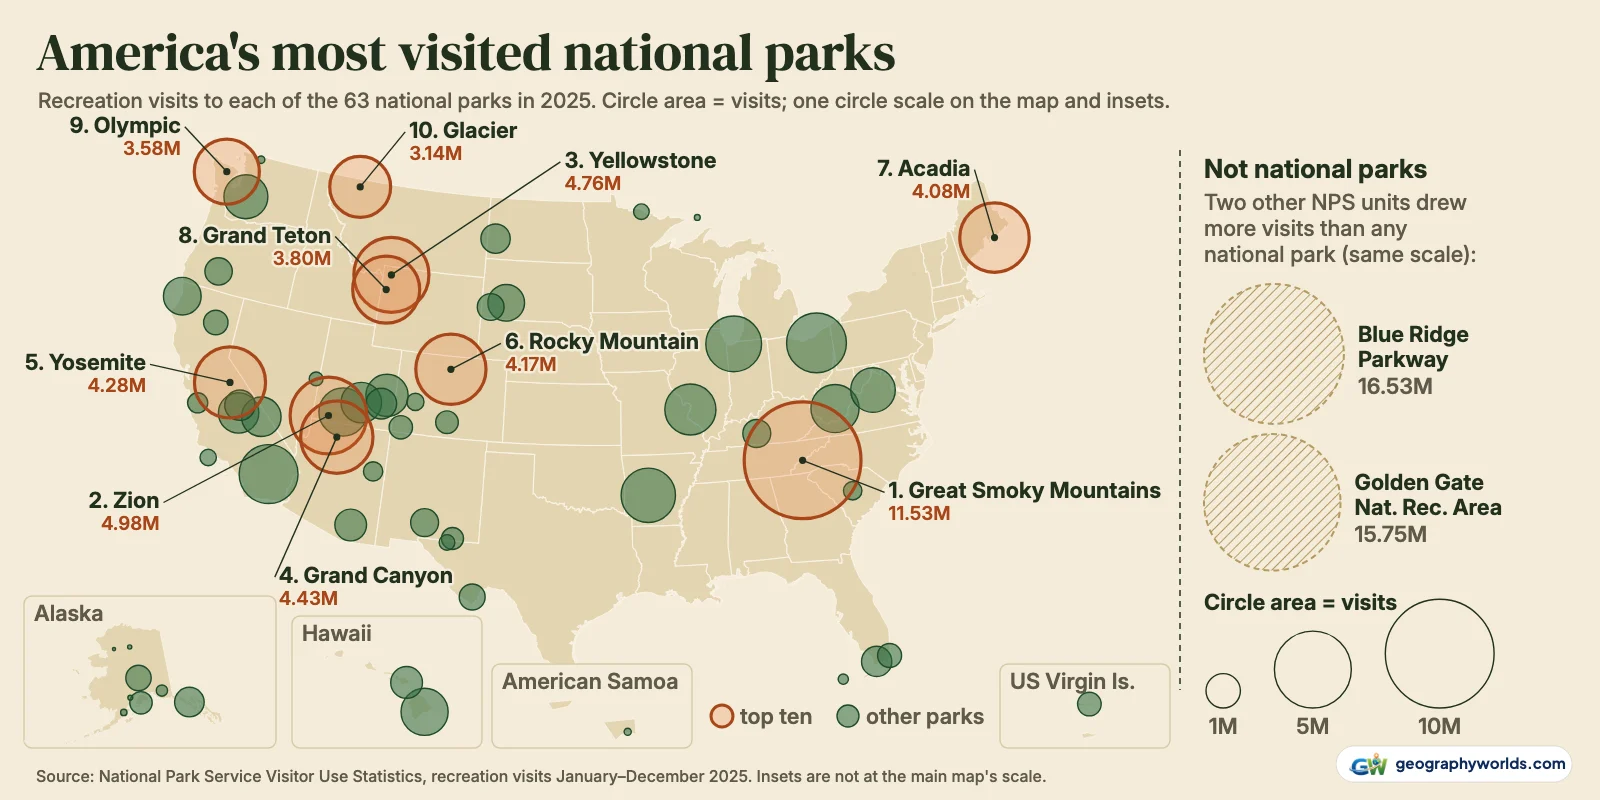
Great Smoky Mountains was the most visited national park in the United States in 2025, with 11,527,939 recreation visits, 2.3 times as many as second-placed Zion (4,984,525). Yellowstone (4,762,988), Grand Canyon (4,430,653) and Yosemite (4,278,413) complete the top five, followed by Rocky Mountain, Acadia, Grand Teton, Olympic and Glacier. Those figures are the National Park Service's count of recreation visits from January to December 2025, the latest complete year, for the 63 parks that carry the title "national park". Two other kinds of NPS site drew even more: the Blue Ridge Parkway (16,533,753) and Golden Gate National Recreation Area (15,748,676) are the busiest units in the whole system, but neither is a national park, so they are listed separately below.
The National Park Service manages 433 units, and only 63 of them are national parks; the rest are monuments, historic sites, seashores, parkways, trails and recreation areas. Across the whole system NPS recorded 323,014,305 recreation visits in 2025, 2.7% fewer than the record 331.9 million of 2024. The 63 national parks took 93.9 million of them, 29% of the total, and their combined count barely moved: it fell by 0.4%.
Why the Smokies run away with it
Great Smoky Mountains has been first among the national parks in every year since at least 2016, and never by a small margin: in each of the last ten years it had nearly 1.8 times or more the visits of the park in second place. On its own it accounts for 12% of all national park visits. Its 2025 total was 5.4% lower than the 12,191,834 of 2024 and well below its 2021 high of 14,161,548.
Price is part of the reason. The big western parks charge an entrance fee: Zion's fee page lists $35 for a private vehicle for up to seven days, as do Yellowstone and Grand Canyon. The Smokies' own fees page has no entrance pass to sell. Instead, anyone parking for longer than 15 minutes needs a parking tag, at $5 a day, $15 a week or $40 a year, and the page states that "the parking tag is not an entrance fee".
The other reason is the towns at the gates. When the federal government shut down on 1 October 2025, the park fully reopened on 4 October because local governments paid to staff it: the State of Tennessee, Sevier, Blount and Cocke counties, the cities of Gatlinburg, Pigeon Forge and Sevierville, the Eastern Band of Cherokee Indians and the park's charity all put money in, Friends of the Smokies explained, adding that visitors spent more than $2 billion in nearby communities in 2024.

Plenty of people also drive through, and NPS keeps that traffic out of the ranking. Besides its recreation visits, the park logged 10.8 million non-recreation visits in 2025, the category NPS uses for people crossing the park for their own convenience, such as commuters on park roads. Our guide to Great Smoky Mountains National Park covers the ridges, the wildlife and the old farmsteads of Cades Cove.
All 63 parks, ranked
Below the Smokies the field is tight. Only 26 of the 63 parks passed a million recreation visits in 2025; the median park had about 740,000. The ten busiest shared 52% of all national park visits, while eight parks had fewer than 100,000. The least visited was Kobuk Valley in Alaska, with 7,786.
| Rank | National park | State | Recreation visits, 2025 | Change from 2024 |
|---|---|---|---|---|
| 1 | Great Smoky Mountains | TN, NC | 11,527,939 | −5.4% |
| 2 | Zion | UT | 4,984,525 | +0.8% |
| 3 | Yellowstone | WY, MT, ID | 4,762,988 | +0.4% |
| 4 | Grand Canyon | AZ | 4,430,653 | −9.9% |
| 5 | Yosemite | CA | 4,278,413 | +3.8% |
| 6 | Rocky Mountain | CO | 4,171,431 | +0.4% |
| 7 | Acadia | ME | 4,079,318 | +3.0% |
| 8 | Grand Teton | WY | 3,800,648 | +4.8% |
| 9 | Olympic | WA | 3,584,187 | −3.6% |
| 10 | Glacier | MT | 3,136,557 | −2.3% |
| 11 | Cuyahoga Valley | OH | 3,025,325 | +3.9% |
| 12 | Joshua Tree | CA | 2,932,644 | −2.0% |
| 13 | Indiana Dunes | IN | 2,629,497 | −2.8% |
| 14 | Hot Springs | AR | 2,494,611 | +1.3% |
| 15 | Gateway Arch | MO | 2,209,028 | −13.8% |
| 16 | Bryce Canyon | UT | 1,967,367 | −21.2% |
| 17 | New River Gorge | WV | 1,958,440 | +8.1% |
| 18 | Hawaii Volcanoes | HI | 1,877,854 | +31.0% |
| 19 | Shenandoah | VA | 1,682,152 | −2.2% |
| 20 | Mount Rainier | WA | 1,635,342 | +0.9% |
| 21 | Arches | UT | 1,511,740 | +3.1% |
| 22 | Capitol Reef | UT | 1,388,476 | −2.4% |
| 23 | Sequoia | CA | 1,378,337 | +5.3% |
| 24 | Death Valley | CA, NV | 1,320,134 | −8.4% |
| 25 | Redwood | CA | 1,202,480 | +93.1% |
| 26 | Badlands | SD | 1,139,361 | +4.1% |
| 27 | Haleakala | HI | 853,711 | +16.6% |
| 28 | Saguaro | AZ | 847,749 | −10.4% |
| 29 | Canyonlands | UT | 796,057 | −2.7% |
| 30 | Kings Canyon | CA | 779,791 | +11.5% |
| 31 | Everglades | FL | 778,198 | +4.9% |
| 32 | Glacier Bay | AK | 740,044 | +0.5% |
| 33 | Theodore Roosevelt | ND | 729,893 | −0.4% |
| 34 | Mammoth Cave | KY | 660,734 | −11.6% |
| 35 | White Sands | NM | 659,742 | −6.1% |
| 36 | Crater Lake | OR | 632,242 | +25.2% |
| 37 | Wind Cave | SD | 606,258 | +23.9% |
| 38 | Big Bend | TX | 568,104 | +1.2% |
| 39 | Denali | AK | 543,300 | +16.5% |
| 40 | Lassen Volcanic | CA | 504,777 | +41.1% |
| 41 | Biscayne | FL | 486,567 | −5.0% |
| 42 | Virgin Islands | VI | 471,074 | +11.4% |
| 43 | Mesa Verde | CO | 463,130 | −3.5% |
| 44 | Great Sand Dunes | CO | 432,498 | −1.2% |
| 45 | Kenai Fjords | AK | 425,369 | +1.4% |
| 46 | Carlsbad Caverns | NM | 410,778 | −10.8% |
| 47 | Pinnacles | CA | 343,208 | −3.1% |
| 48 | Petrified Forest | AZ | 315,951 | −43.5% |
| 49 | Congaree | SC | 287,833 | +18.9% |
| 50 | Black Canyon of the Gunnison | CO | 250,086 | −25.5% |
| 51 | Channel Islands | CA | 227,186 | −13.5% |
| 52 | Guadalupe Mountains | TX | 206,423 | −8.7% |
| 53 | Voyageurs | MN | 206,326 | +3.7% |
| 54 | Great Basin | NV | 161,210 | +6.0% |
| 55 | Wrangell–St. Elias | AK | 108,840 | +33.3% |
| 56 | Dry Tortugas | FL | 89,355 | +5.3% |
| 57 | North Cascades | WA | 46,925 | +184.7% |
| 58 | American Samoa | AS | 43,258 | +91.7% |
| 59 | Katmai | AK | 34,479 | −4.8% |
| 60 | Isle Royale | MI | 29,091 | +1.0% |
| 61 | Lake Clark | AK | 19,778 | +6.9% |
| 62 | Gates of the Arctic | AK | 14,923 | +25.3% |
| 63 | Kobuk Valley | AK | 7,786 | −54.8% |
A few names in the top 20 are easy to miss. Cuyahoga Valley in northeast Ohio is 11th with 3.03 million visits, Indiana Dunes 13th, Hot Springs in Arkansas 14th and Gateway Arch, in downtown St. Louis, 15th. Cuyahoga Valley and Hot Springs both say on their fee pages that no entrance pass is required (Cuyahoga Valley, Hot Springs).
Parkways and recreation areas that beat every national park
Rank every unit NPS manages and the Smokies come third. The Blue Ridge Parkway, a scenic road, recorded 16.5 million recreation visits, and Golden Gate National Recreation Area, around San Francisco, 15.7 million. Below the Smokies come the Natchez Trace Parkway (8.0 million), the Lincoln Memorial (7.7 million) and more: nine units that are not national parks had more visits than Zion, the second-busiest national park. Of the 20 busiest units in the system, only 7 are national parks. The NPS release for 2025 puts the parkway and Golden Gate in first and second place with the same figures.
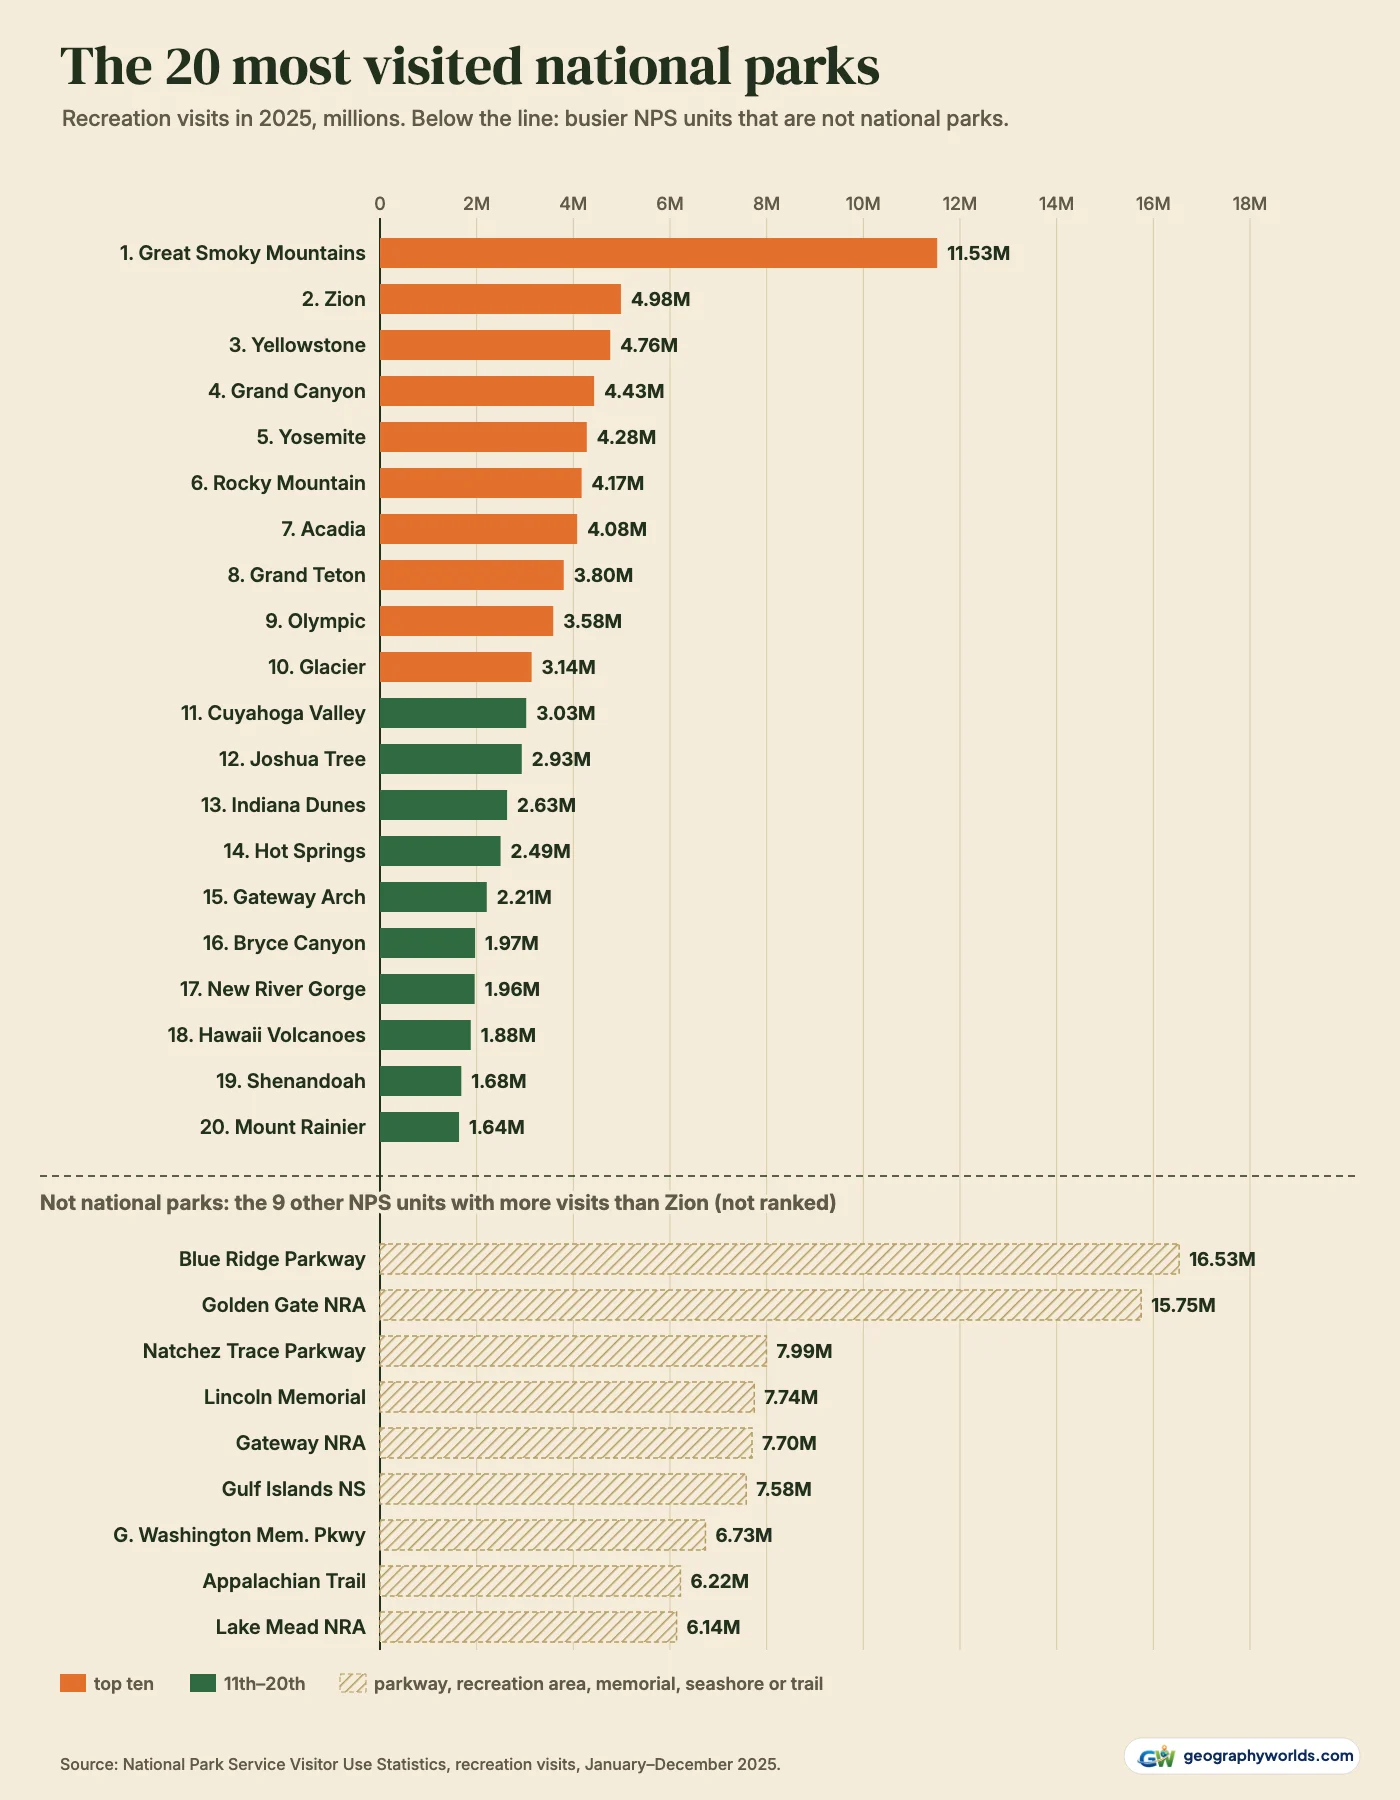
That does not make the parkway a busier wilderness than the Smokies. A visit is counted at every entry, and roads and city-edge recreation areas are entered far more often than remote parks.
Six eastern parks outdraw every western region
The map at the top of this page shows where the visits go. Group the parks by region and the six in the Appalachians and the East (the Smokies, Acadia, New River Gorge, Shenandoah, Mammoth Cave and Congaree) had 20.2 million visits between them, more than any other region, with the Smokies supplying 57% of that. The thirteen parks of California and the Pacific Northwest had 18.9 million, and the thirteen in the desert Southwest, Utah to Texas, 18.2 million.
Utah's five parks, Zion, Bryce Canyon, Arches, Capitol Reef and Canyonlands, had 10,648,165 visits together. An early count by KSL, using preliminary data in January, put them at a little more than 11 million; the final NPS figures are lower. Zion alone had 4,984,525, its second-best year of the decade after 2021's 5,039,835; our Zion National Park guide explains the canyon that draws them. At the other extreme, Alaska's eight national parks had 1.89 million visits in all, under a sixth of the Smokies' total. The busiest of them was Glacier Bay, with 740,044.
Summer parks and four-season parks
NPS reports every park month by month, and the monthly figures show which parks live on summer. Yellowstone had 975,109 recreation visits in July 2025 and 26,961 in November; 58% of its year came in June, July and August. Among parks with more than a million visits, Mount Rainier was the most concentrated, at 68%, with Glacier next at 66%. Acadia on the Maine coast went from 13,183 visits in January to 844,268 in August.
The Smokies are the opposite. Their quietest month, January, still brought 276,999 visits, and their busiest was not a summer month at all but October, with 1.56 million. Only 33% of their visits fell in summer. Zion is similarly spread out (32%), and Joshua Tree, in the California desert, peaks in March and takes just 15% of its visits in the summer months.
Ten years of visits: 2020, a flood, a fire and a shutdown
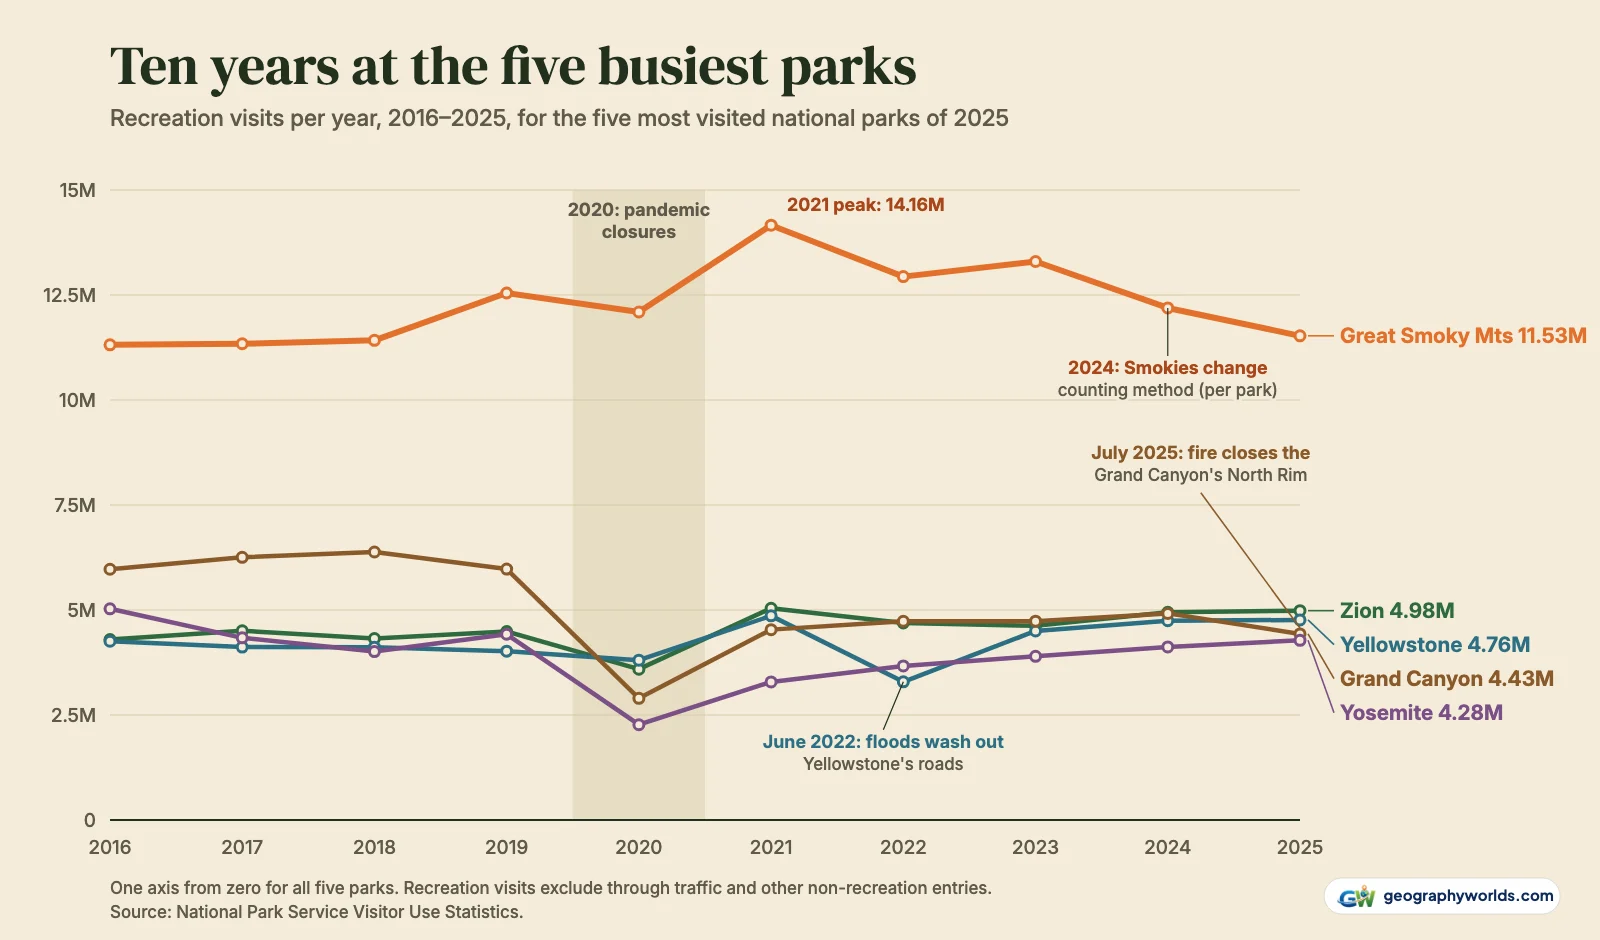
In 2020 the system's visits fell from 327.5 million to 237.1 million, a drop of 27.6%, after temporary pandemic closures of almost all parks that spring. The five parks on the chart fell very unevenly. Grand Canyon lost 52%, falling from 5.97 million to 2.9 million, and Yosemite 49%; the Smokies slipped just 3.6%. The rebound in 2021 set ten-year highs for both the Smokies (14.2 million) and Zion.
Yellowstone's worst year of the decade was not 2020 but 2022. Floods that began on 12 June washed out roads and bridges and closed the park's northern loop for nearly three weeks, PBS NewsHour reported. The park had 525,363 visits that June against 938,845 a year earlier, and 3.29 million for the year, below even its 2020 total of 3.81 million. By 2025 it was back to 4.76 million.
Grand Canyon was second among national parks every year from 2016 to 2019 and peaked at 6.38 million in 2018. It never fully recovered from 2020, and in 2025 it slipped to fourth, 10% below 2024. In July the Dragon Bravo Fire destroyed the Grand Canyon Lodge and closed the North Rim for the rest of the season, WJLA reported; the park's visits from July to December were 14% lower than in the same months of 2024. Our Grand Canyon National Park guide covers both rims.
Two more breaks in the series are about counting rather than crowds. Gatlinburg Now attributed much of the Smokies' fall from 13.3 million in 2023 to 12,191,834 in 2024 to a change in how the park counts visitors; Dave Barak, then the park's spokesman, said the revisions account for vehicles that re-enter and for how many people ride in each vehicle. Its preliminary 2025 count, 11,538,876, was slightly above the final 11,527,939. And the 43-day partial government shutdown, ran from 1 October to 12 November 2025; Yellowstone, for one, stayed open with few services, Bigfoot 99 reported. System-wide, October and November visits were 5% lower than a year before, against a fall of 2.3% for the other ten months. The Smokies, kept open by local money, had 1.56 million visits in October, short of the 1.64 million average of 2020–2024 that Friends of the Smokies cites.
What counts as a visit
NPS defines a recreation visit as "the entry of a person onto lands or waters administered by the NPS", minus non-recreation and non-reportable entries, and counts same-day re-entries as a single visit, according to its statistics definitions. A visit is not a visitor: someone who returns on three days counts three times. Every figure here is the sum of each park's monthly recreation visits from the NPS Visitor Use Statistics service, January to December. We use recreation visits throughout, because that is the measure NPS ranks parks by. Non-recreation visits matter in a few places: Saguaro, near Tucson, logged 4.57 million of them against 847,749 recreation visits, which leaves it 28th in the ranking.
The file has all 63 national parks with their states, region, map position and every year from 2016 to 2025, plus the nine busier units that are not national parks; download the data as a CSV. Pick out the parks on your own list and Parity will chart those rows for you from the spreadsheet. The sources:
- National Park Service, Visitor Use Statistics (IRMA Stats), monthly recreation and non-recreation visits by park: every reporting unit, 2016–2025, read through the IRMA Stats web service; a U.S. Government work (see the NPS disclaimer below)
- National Park Service, website disclaimer: material created by the NPS "is generally considered in the public domain"
- National Park Service, news release on 2025 visitation (13 March 2026)
- National Park Service, Visitor Use Statistics definitions
- National Park Service, The National Park System (units by designation)
- National Park Service Land Resources Division, park boundary centroids: used to place each park on the map; public domain
- US Census Bureau cartographic boundaries via us-atlas 3.0.1: state outlines; public domain
If the Smokies' crowds sound like too much, Acadia, seventh with 4.08 million visits but almost empty in winter, is a quieter season away, as our guide to Acadia National Park describes.