Modern maps are created using a sophisticated combination of technologies: satellite imagery captures the Earth's surface from orbit, GPS provides precise location coordinates, aerial photography and LiDAR (Light Detection and Ranging) capture detailed terrain data, and ground surveys verify measurements on the ground. Geographic information systems (GIS) combine these data sources into layered digital maps.
Introduction
Cartography — the art and science of mapmaking — has evolved from hand-drawn representations based on exploration and dead reckoning to precise digital products updated in near-real-time. Google Maps, for example, is updated continuously using satellite imagery, Street View data, user reports, and machine learning algorithms that detect changes in roads and buildings.

The Short Answer
- Primary Data Sources: Satellites, GPS, aerial photography, LiDAR, ground surveys
- Processing: Geographic Information Systems (GIS) software
- Key Projections: Mercator, Robinson, Winkel Tripel, and others
- Modern Updates: Continuous via satellite imagery and crowdsourced data
Creating a map involves three fundamental steps: data collection (measuring the location, shape, and attributes of features on Earth's surface), data processing (organizing measurements into a coherent spatial framework), and representation (displaying the data as a visual product that humans can understand and use).
Every map involves a map projection — a mathematical formula for representing the curved surface of a sphere on a flat surface. No projection can preserve all properties simultaneously; every map distorts area, shape, distance, or direction to some degree. The familiar Mercator projection preserves direction but dramatically distorts area near the poles, making Greenland appear as large as Africa (it is actually 14 times smaller).
The Science Behind It
- Satellite Imagery: Landsat, Sentinel, commercial satellites capture Earth's surface
- GPS: Global Navigation Satellite System provides precise coordinates (±1 cm with RTK)
- LiDAR: Laser scanning creates 3D terrain models at centimeter resolution
- GIS: Software that stores, analyzes, and displays spatial data in layers
Earth observation satellites like Landsat (operational since 1972) and the European Sentinel constellation capture multispectral imagery of the entire Earth's surface every few days. Commercial satellites from Planet Labs, Maxar, and Airbus provide imagery with resolution as fine as 30 centimeters — detailed enough to identify individual vehicles and trees.
LiDAR has revolutionized terrain mapping. By firing millions of laser pulses per second from aircraft or drones, LiDAR creates detailed 3D models of the ground surface. Crucially, LiDAR can penetrate vegetation, revealing the ground surface beneath forest canopy — a capability that has led to the discovery of lost cities and archaeological sites in jungles worldwide.
Types & Variations
- Topographic Maps: Show terrain, elevation, water features (USGS, Ordnance Survey)
- Thematic Maps: Display specific data (population, climate, geology)
- Nautical Charts: Navigation maps for maritime use (NOAA, Admiralty)
- Digital/Web Maps: Interactive online maps (Google Maps, OpenStreetMap)
Topographic maps, produced by national mapping agencies like the USGS (US) and Ordnance Survey (UK), show detailed terrain information including elevation contours, roads, buildings, vegetation, and water features. These maps use standardized symbols and are essential for hiking, land management, and military operations.
OpenStreetMap (OSM), launched in 2004, is the "Wikipedia of maps" — a free, editable map of the world built by over 10 million volunteers. OSM data is used by Facebook, Apple, and many other companies. In many developing countries, OSM provides better map coverage than any commercial alternative because volunteers map areas that commercial providers ignore.
Famous Examples
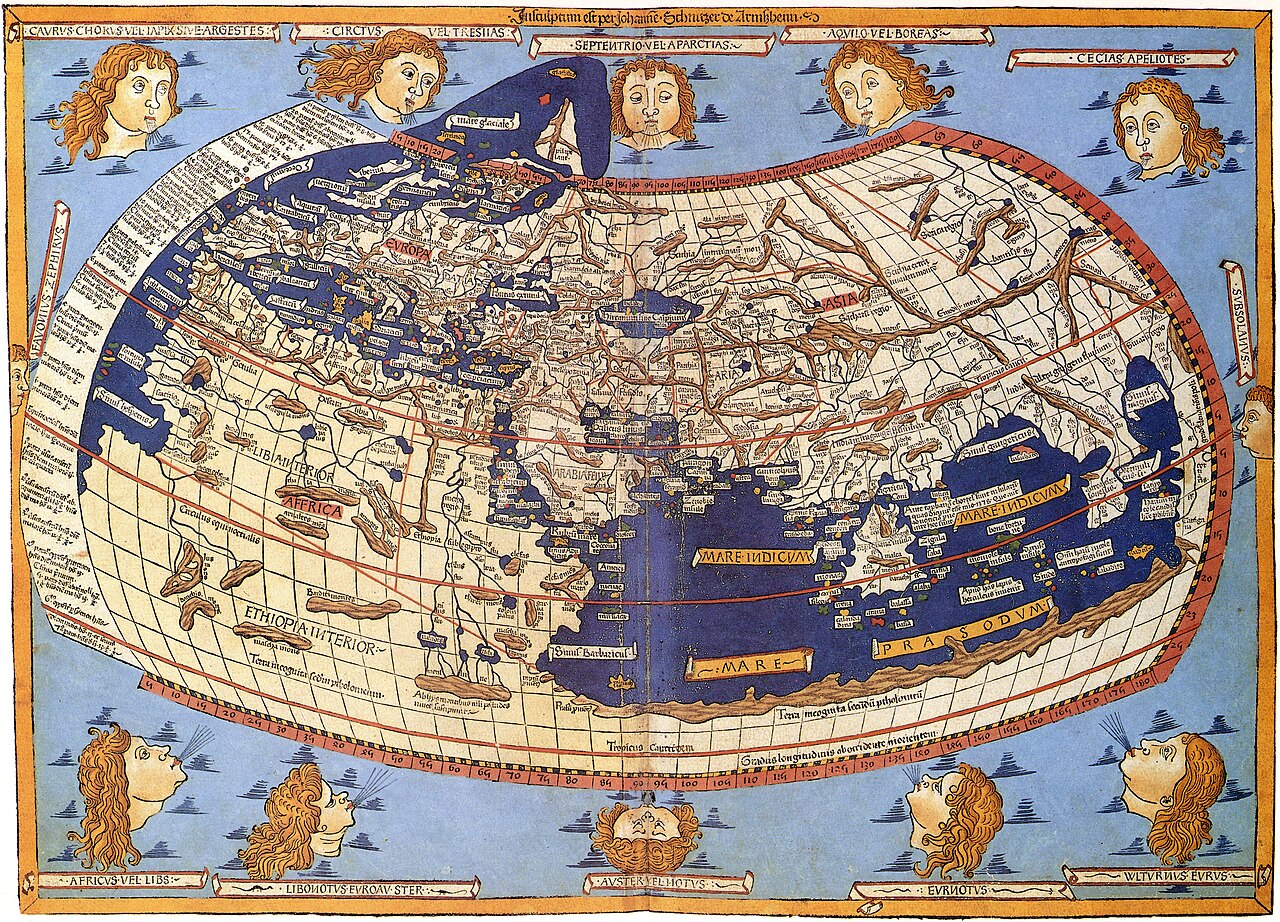
- Ptolemy's Geographia: ~150 CE, first systematic attempt to map the known world
- Mercator Projection: 1569, revolutionized navigation but distorts area
- USGS Topo Maps: Standardized topographic mapping of the US since 1879
- Google Maps: Launched 2005, now used by over 1 billion people monthly
The history of cartography reflects the history of human knowledge. Ptolemy's Geographia (~150 CE) attempted to map the known world using a coordinate grid system. Medieval mappae mundi placed Jerusalem at the center of the world. The Age of Exploration produced increasingly accurate coastlines. The Mercator projection (1569) enabled reliable compass navigation but created the persistent distortion that makes high-latitude regions appear enormous.
Google Maps, launched in 2005, fundamentally changed how most people interact with maps. The platform combines satellite imagery, vector map data, real-time traffic information, Street View imagery, and user-contributed data into an integrated product used by over 1 billion people monthly. Google's continuous updates mean the map is never truly "finished" — it evolves in near-real-time.
Why It Matters
- Navigation: Maps enable everything from driving directions to maritime shipping
- Disaster Response: Rapid mapping of disaster areas saves lives
- Climate Science: Satellite mapping tracks deforestation, ice loss, and urbanization
- Equity: Map coverage gaps often correlate with poverty and marginalization
Modern mapping technologies have enabled unprecedented understanding of Earth's surface. Satellite-based monitoring tracks deforestation in real-time, maps urban growth, measures glacier retreat, and assesses flood risk. The combination of satellite imagery and GIS has become an essential tool for environmental science and disaster response.
Map equity remains a significant issue. Many parts of the developing world are poorly mapped, making disaster response, infrastructure planning, and service delivery more difficult. Projects like Missing Maps, which uses volunteers to map vulnerable communities from satellite imagery, aim to address this gap. The principle that "if you're not on the map, you don't exist" drives efforts to ensure every community is mapped.
Key Facts
- Modern maps use satellite imagery, GPS, LiDAR, aerial photography, and ground surveys as data sources.
- Every map involves a projection that introduces some distortion — no flat map can perfectly represent a sphere.
- LiDAR can penetrate forest canopy, revealing hidden terrain and archaeological features.
- Google Maps is used by over 1 billion people monthly and is updated continuously.
- OpenStreetMap, built by 10 million+ volunteers, provides the best free map data in many developing countries.
Fun Facts
- The Mercator projection makes Greenland appear the same size as Africa, though Africa is actually 14 times larger.
- LiDAR revealed the remains of a massive Maya city in the Guatemalan jungle in 2018 that had been hidden under dense vegetation.
- Google's Street View cars have driven over 16 million kilometers, covering 100+ countries.
- The oldest known map is a Babylonian clay tablet from ~600 BCE showing the world as a flat disc surrounded by ocean.
Final Thoughts
Maps are made through a remarkable convergence of satellite technology, ground measurement, mathematical projection, and digital processing. From Ptolemy's hand-drawn atlas to Google's real-time digital maps, the quest to accurately represent Earth's surface has driven some of humanity's greatest technological and scientific advances. In the 21st century, mapping technology is more powerful and accessible than ever — yet significant gaps remain, reminding us that the map is always an imperfect representation of the territory.
Test Your Knowledge!
Curious about geography? Test what you've learned!
Play Geography Games →