
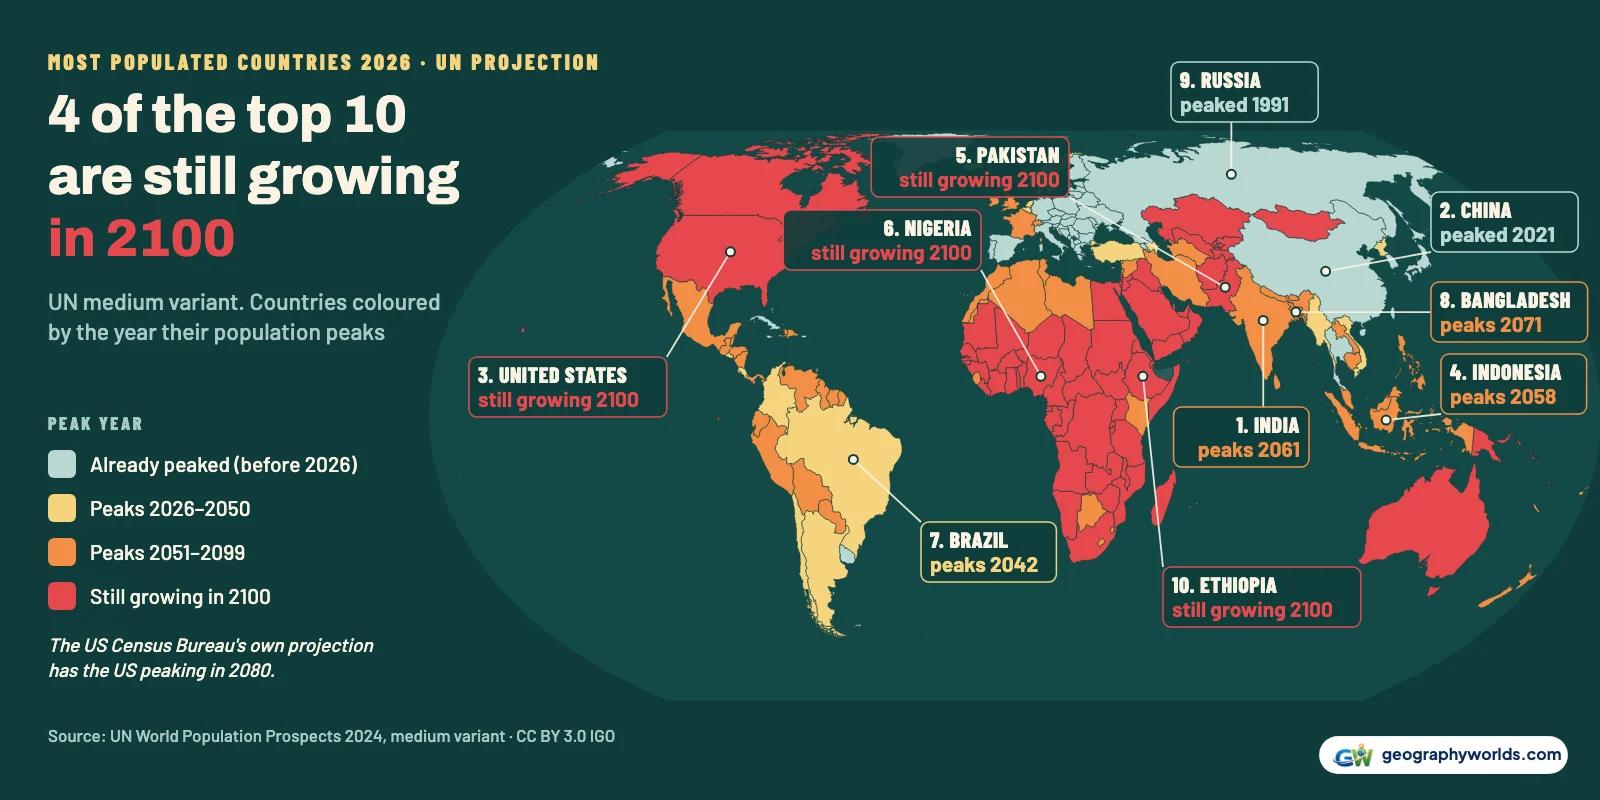
The most populated countries in 2026 are India (1.48 billion), China (1.41 billion), the United States (349.0 million), Indonesia (287.9 million), Pakistan (259.3 million), Nigeria (242.4 million), Brazil (213.6 million), Bangladesh (177.8 million), Russia (143.4 million) and Ethiopia (138.9 million). Those are the United Nations' figures for 1 July 2026 from World Population Prospects 2024, the medium-variant projection. Together the ten hold 56.6% of the 8.30 billion people on Earth. Underneath a stable ranking, two of these ten countries are already shrinking, and in the UN's projection four of them are still growing when its series stops in 2100. One of the four is the United States, and there the US Census Bureau's own projection disagrees.
We downloaded the UN's full demographic indicators file, which gives a population for every country and territory for every year from 1950 to 2100, and found the year each country's population is highest. The map above colours every country by that peak year. Where a national statistics office disagrees, we say so.
The 2026 ranking, with each country's peak year
The UN announced in its Policy Brief No. 153 that India would overtake China in April 2023. The revised 2024 series moves the crossover earlier: India is already ahead on 1 July 2022, though by only 0.24 million. By 2026 the gap is 63.7 million. India alone is 17.8% of humanity; China is 17.0%. The table lists the top 20 with the UN's figure for 1 July 2026, the year that country's population peaks in the medium variant, and where it ends up in 2100.
| Rank | Country | Population, 1 July 2026 | Share of world | Peak year | Population, 2100 |
|---|---|---|---|---|---|
| 1 | India | 1,476,625,576 | 17.8% | 2061 | 1,505,251,761 |
| 2 | China | 1,412,914,089 | 17.0% | 2021 (passed) | 633,368,113 |
| 3 | United States | 349,035,494 | 4.2% | after 2100 | 421,278,889 |
| 4 | Indonesia | 287,886,782 | 3.5% | 2058 | 295,511,061 |
| 5 | Pakistan | 259,299,792 | 3.1% | after 2100 | 511,000,618 |
| 6 | Nigeria | 242,431,832 | 2.9% | after 2100 | 476,747,781 |
| 7 | Brazil | 213,562,666 | 2.6% | 2042 | 163,364,064 |
| 8 | Bangladesh | 177,818,044 | 2.1% | 2071 | 208,596,516 |
| 9 | Russia | 143,394,458 | 1.7% | 1991 (passed) | 126,386,515 |
| 10 | Ethiopia | 138,902,185 | 1.7% | after 2100 | 367,289,596 |
| 11 | Mexico | 132,997,658 | 1.6% | 2058 | 130,248,836 |
| 12 | Japan | 122,427,731 | 1.5% | 2009 (passed) | 76,845,989 |
| 13 | Egypt | 120,101,175 | 1.4% | after 2100 | 201,895,184 |
| 14 | Philippines | 117,724,472 | 1.4% | 2057 | 114,221,909 |
| 15 | DR Congo | 116,452,162 | 1.4% | after 2100 | 430,709,445 |
| 16 | Vietnam | 102,177,431 | 1.2% | 2049 | 91,705,108 |
| 17 | Iran | 93,168,497 | 1.1% | 2053 | 80,045,291 |
| 18 | Turkey | 87,926,082 | 1.1% | 2047 | 65,338,458 |
| 19 | Germany | 83,644,258 | 1.0% | 2024 (passed) | 70,899,863 |
| 20 | Tanzania | 72,563,780 | 0.9% | after 2100 | 262,834,721 |
In the peak column, Japan, 12th with 122.4 million, peaked in 2009 in the UN series. Germany, 19th, has just peaked too. Mexico, Indonesia and the Philippines all top out in the late 2050s. The bold rows, the countries with no peak before 2100, are concentrated in Africa and South Asia, plus one large exception in North America.
Across all 237 countries and territories in the file, 64 had already passed their peak before 2026. They hold 27.2% of the world's people today. At the other end, 75 countries are still growing in 2100, and they hold 28.9% of today's population. The rest, a little under half of humanity, live in countries that peak somewhere in between.
China and Russia: already on the way down
In the UN's estimates, China's population reached its high point of 1.43 billion in 2021 and has fallen every year since; by 1 July 2026 it is 13.5 million below that peak. China's National Bureau of Statistics counts fewer people but agrees on the turn. It put the population at 1,412.60 million at the end of 2021, then reported a fall of 0.85 million in 2022 and of 3.39 million in 2025, to 1,404.89 million. The medium variant has China at 1.26 billion in 2050 and 633.4 million in 2100, a fall of 56% from the peak. It stays second throughout, but by 2100 it is far closer in size to Pakistan than to India.
The reason is in the fertility column of the same file. In 2026 the average Chinese woman is expected to have 1.03 children over her lifetime, about half the level that replaces a generation, and the median Chinese resident is 40.6 years old. With so few births, each generation is roughly half the size of the one before it, and that compounds. The UN projects China's median age reaching 60.7 by 2100. Our guide to the population of China covers the province-level picture.
Russia peaked much earlier: at 149.4 million in 1991 in the UN series. Rosstat's own national series puts the high point slightly later and lower, at 148.6 million on 1 January 1993. In the UN figures Russia has stayed between 143.4 million and 148.9 million every year since, propped up by immigration: net arrivals of about 325,000 people in 2026. That cushion does not stop a slow slide. The medium variant has Russia dropping out of the top 10 in 2033, when the DR Congo passes it, and reaching 126.4 million in 2100, 17th in the world. In 1950 it was fourth.
Japan shows where that path leads. It peaked at 128.2 million in 2009 in the UN series; Japan's Statistics Bureau dates its peak a year earlier, at 128.08 million on 1 October 2008. Japan's median age is 50.2 in 2026, and the UN projects a fall to 76.8 million by 2100. More in our article on the population of Japan.
India, Indonesia and Brazil: growth with an end date
India's lead over China will widen for decades, but India is not on an endless climb either. The medium variant has India peaking at 1.70 billion in 2061, then easing to 1.51 billion by 2100. India's fertility rate in 2026 is 1.93 children per woman, already below replacement. The population keeps rising for another 35 years because the country is young, with a median age of 29.2, so the number of women of childbearing age keeps growing even as each has fewer children. Demographers call this population momentum.
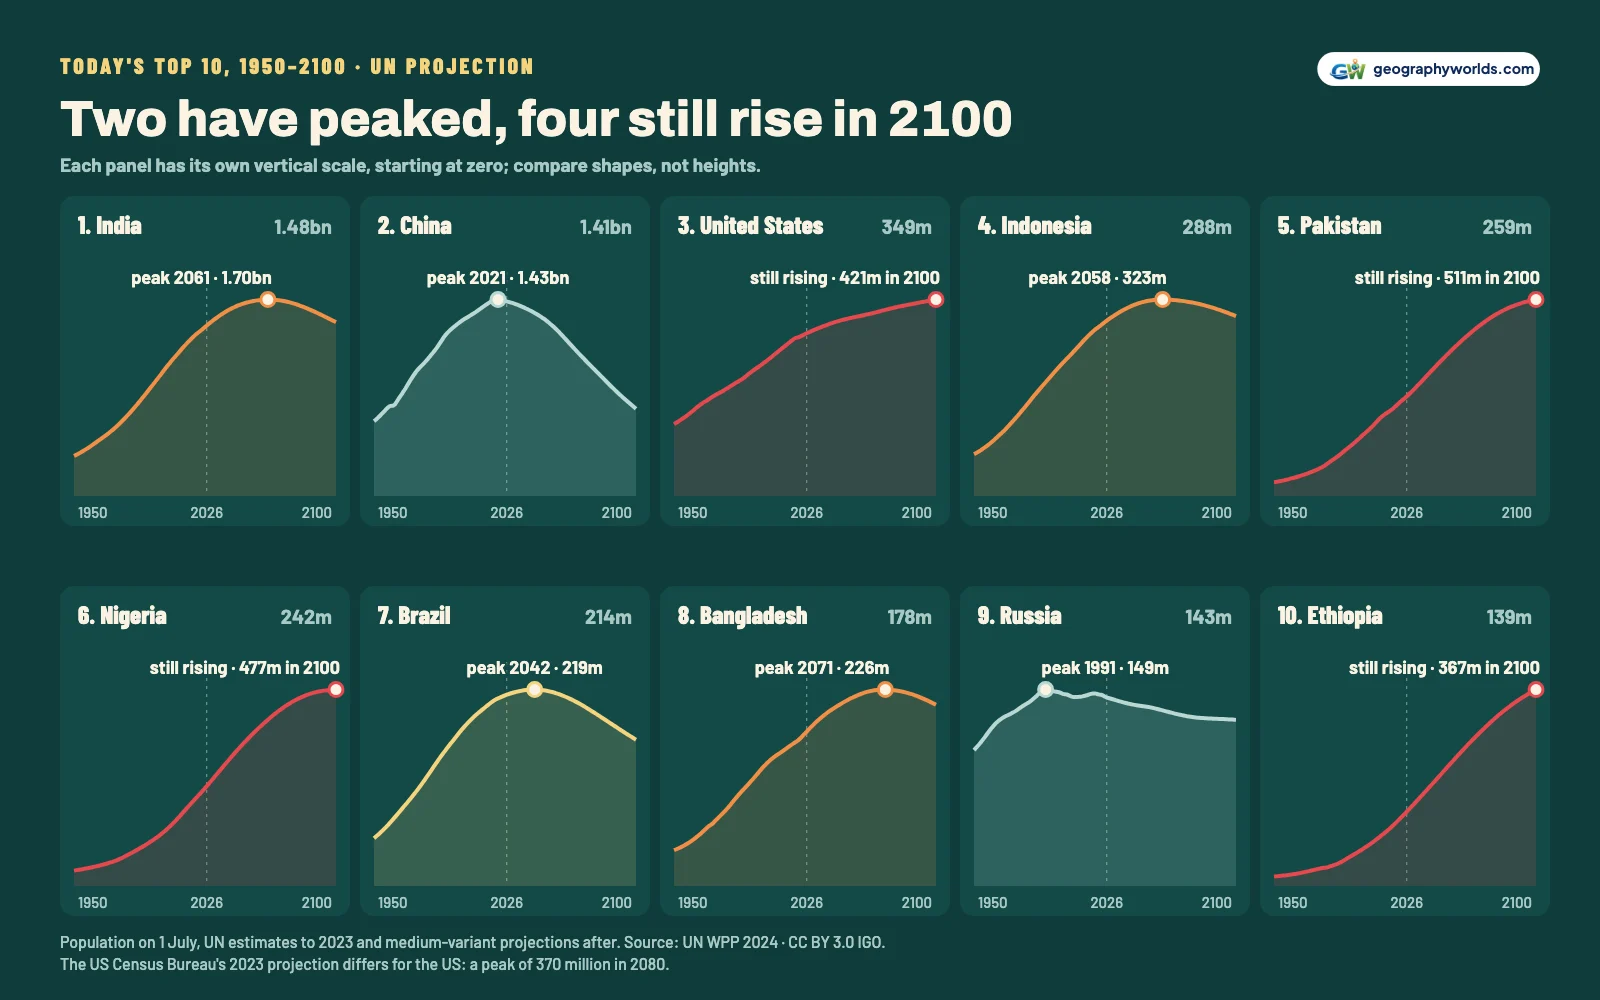
The same shape, a rise that flattens and then turns, applies to most of the middle of the table. Brazil peaks first of the group, at 219.3 million in 2042, and shrinks to 163.4 million by 2100, slipping to 12th place. Indonesia tops out at 322.6 million in 2058, Mexico in 2058, and Bangladesh keeps growing until 2071, again mostly on momentum.
Four countries the UN sees still growing in 2100
That leaves four of today's top 10 whose populations are higher in 2100 than in 2099 in the UN projection: Ethiopia, Nigeria, Pakistan and the United States. Three grow for the reason you would expect. The fourth does not, and other forecasters disagree about it.

Pakistan, Nigeria and Ethiopia still have high birth rates and very young populations. In 2026 the UN puts the fertility rate at 3.44 in Pakistan, 4.20 in Nigeria and 3.72 in Ethiopia, and half of all Nigerians are younger than 18.3. Pakistan grows from 259.3 million today to 371.9 million in 2050 and 511.0 million in 2100. Nigeria goes from 242.4 million to 359.2 million and then 476.7 million, and Ethiopia from 138.9 million to 225.0 million and 367.3 million. Fertility falls steadily in all three, so growth slows; Nigeria's last projected year adds just 0.03%, essentially a plateau. Our population of Nigeria guide goes state by state.
The United States is the odd one out. Its fertility rate in 2026 is 1.62, lower than India's, and the UN expects deaths to outnumber births from 2042. What keeps the UN's line rising is migration: net arrivals of about 1.18 million a year in 2026 and still 1.23 million in 2100. On those assumptions the US grows from 349.0 million today to 380.8 million in 2050 and 421.3 million in 2100. The US Census Bureau's 2023 projection is lower. Its main series has deaths overtaking births in 2038, the population peaking at about 370 million in 2080 and falling to 366 million by 2100. The difference is almost entirely the immigration assumption, which US policy could move in either direction.
The top 10 in 2050 and 2100
The top three stay put to mid-century. In 2050 the UN's top 10 is India, China, United States, Pakistan, Nigeria, Indonesia, Ethiopia, DR Congo, Brazil and Bangladesh. Pakistan and Nigeria both overtake Indonesia, Ethiopia climbs three places, and the Democratic Republic of the Congo, 15th in 2026 with 116.5 million, enters at eighth with 218.2 million. Russia drops out.
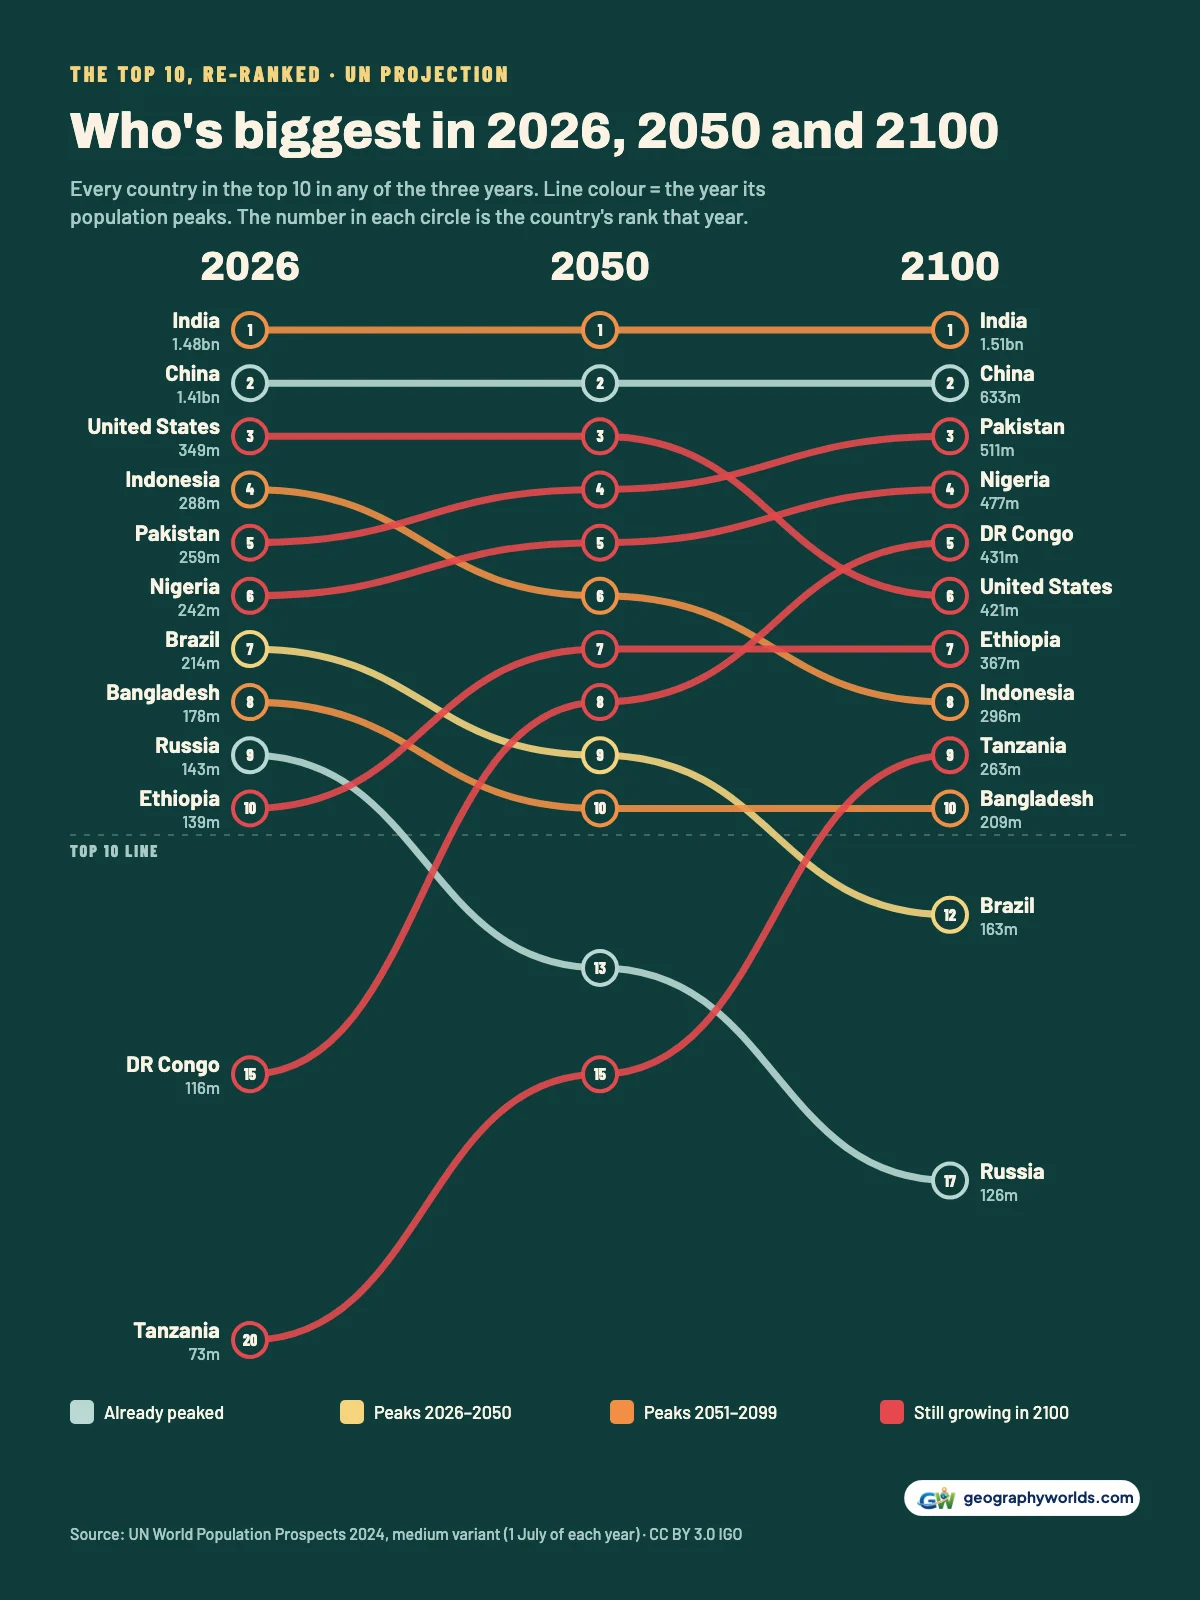
By 2100 the change is bigger. The projected top 10 is India, China, Pakistan, Nigeria, DR Congo, United States, Ethiopia, Indonesia, Tanzania and Bangladesh. Pakistan passes the United States around 2053 and Nigeria around 2057, and the DR Congo, whose fertility rate in 2026 is 5.80 and whose median resident is just 15.9 years old, overtakes the US around 2097 on the way to 430.7 million. Tanzania, 20th today with 72.6 million, climbs to 9th with 262.8 million. Brazil and Russia fall out. Four of the 2100 top 10 are in sub-Saharan Africa, compared with two in 2026.
Gaining people, 2026 to 2100
Losing people, 2026 to 2100
Between 2026 and 2100, Pakistan, Nigeria and Ethiopia each add well over 200 million people, while China loses 779.5 million, more than twice the current population of the United States. The world as a whole grows from 8.30 billion now to 9.66 billion in 2050, peaks at 10.29 billion in 2084, and eases to 10.18 billion by 2100.
Reading a 75-year projection
The figures after 2023 are projections, not forecasts. The UN builds them from assumptions about fertility, mortality and migration for each country, and the medium variant is the central path of several. Small differences compound over 75 years. If Nigerian or Pakistani birth rates fall faster than assumed, both would peak inside the century; if China's fertility recovers, its decline would be shallower. Other projections land elsewhere: the Census Bureau's International Database has the world peaking later and higher, at 10.6 billion in 2092. For the US in 2026, the Census Bureau's estimate is 342.6 million, against the UN's 349.0 million.
Even the starting points are uncertain. The UN's estimates run to 2023, built from censuses, surveys and registration data, but those inputs vary in age and quality. Nigeria's last census was in 2006; its planned 2023 count, the first in 17 years, was postponed. Pakistan's 2023 census counted 241.49 million people, while the UN estimate for mid-2023 is 247.5 million. The 2050 list is fairly safe all the same, because most of the people who will be adults in 2050 are already born.
Population here means everyone living in a country on 1 July, the UN's standard reference date. Peak year is the calendar year with the highest 1 July figure in the 1950 to 2100 series, so "still growing in 2100" means the 2100 figure is higher than 2099's; the series simply ends there. You can download the data as a CSV, with every country's 2026, 2050 and 2100 population, its rank in each year, its peak year and its 2026 fertility rate and median age. Parity can turn a spreadsheet like this one into charts worth sharing.
Sources:
- UN DESA Population Division, World Population Prospects 2024 (Demographic Indicators, medium variant, CSV): Released 11 July 2024. Total population on 1 July of each year, estimates to 2023 and medium-variant projections to 2100. © United Nations, CC BY 3.0 IGO.
- Natural Earth country boundaries via world-atlas (1:50m): Public domain. Used for the map only.
Countries are only half of the story of where people live; to see how those 8.30 billion people are packed into the world's biggest urban areas, the most populated cities in the world ranking picks up where this one leaves off.