
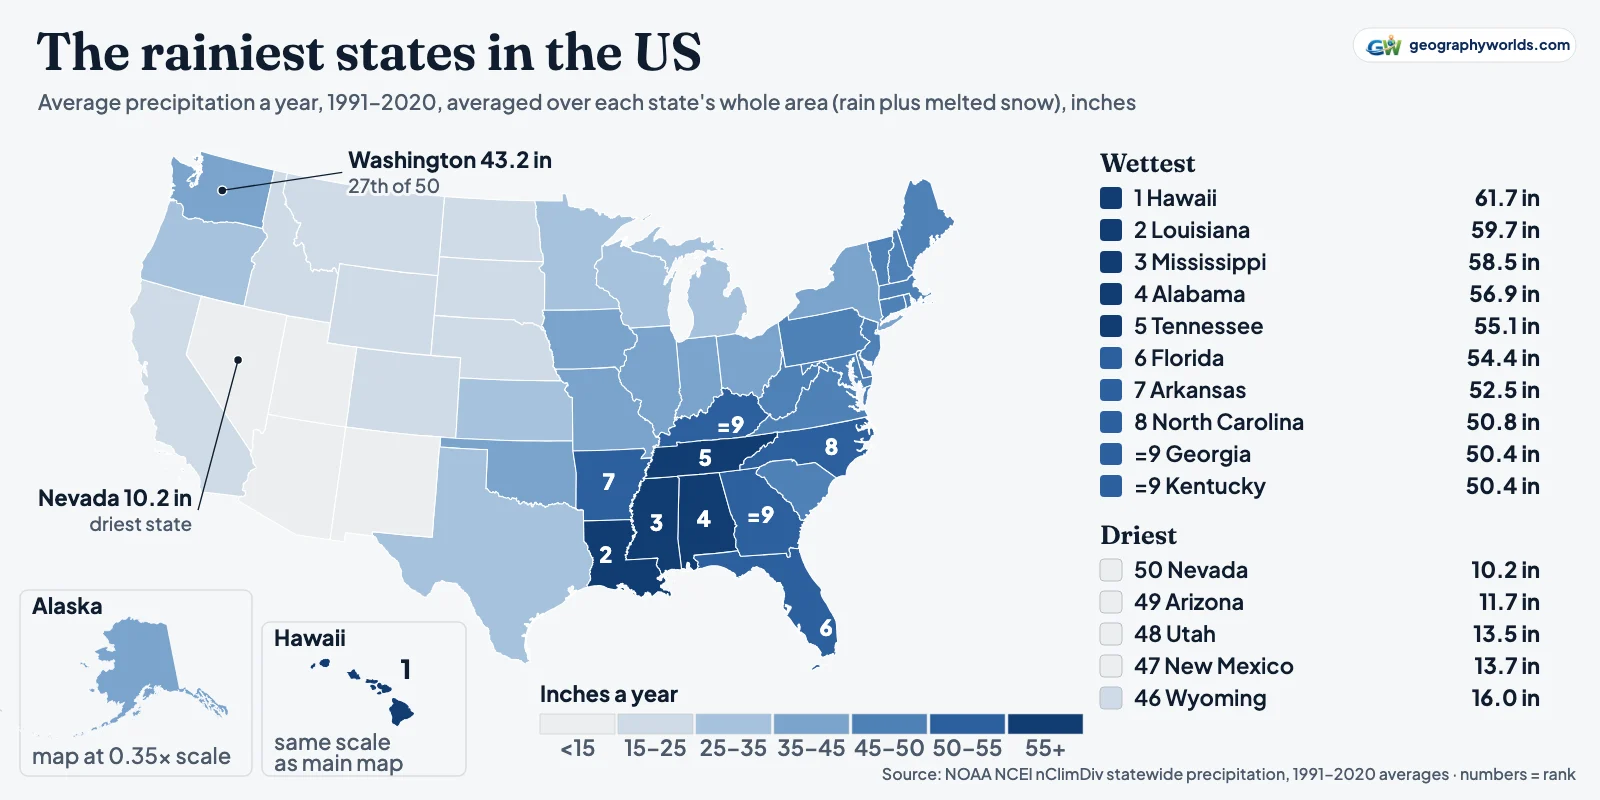
The rainiest state in the US is Hawaii, with an average of 61.7 inches (1,568 mm) of precipitation a year over 1991–2020, averaged across the whole state, in NOAA's statewide climate records. The rest of the top ten, in order: Louisiana (59.7 in), Mississippi (58.5), Alabama (56.9), Tennessee (55.1), Florida (54.4), Arkansas (52.5), North Carolina (50.8), and Georgia and Kentucky, level at 50.4 in for ninth place. Washington, the state with the rainy name, is 27th at 43.2 in. The driest state is Nevada (10.2 in), followed by Arizona (11.7), Utah (13.5), New Mexico (13.7) and Wyoming (16.0).
The figures come from NOAA's National Centers for Environmental Information (NCEI), the series behind its Climate at a Glance pages. The map at the top shades every state by that 1991–2020 average. Its surprise is in the northwest corner.
Washington's rainy name, checked against the gauges
Averaged over the whole state, Washington gets 43.2 in a year. That puts it 27th of the 50 states and 26th of the 48 contiguous ones, with 26 states wetter. Every state on the Atlantic coast, from Maine (45.5 in) to Florida, gets more than Washington does, and so do Indiana (43.6) and Missouri (43.4). It is above the contiguous-US average of 31.3 in, but far from the top.
The statewide number hides a state split in two by the Cascade Range. NOAA divides Washington into ten climate divisions, and their 1991–2020 averages run from 109.8 in (2,788 mm) in the West Olympic Coast division to 10.5 in in the Central Basin east of the mountains, a 10-fold difference inside one state. The Central Basin gets barely more than Nevada's statewide 10.2 in. Washington's average sits between the two because it covers both, the wet ocean side of the mountains and the dry lee side described in our explainer on the rain shadow effect.
Seattle's reputation is a story about frequency, not volume. NCEI's 1991–2020 station normals, a separate product from the state averages and measured at single gauges, give Seattle–Tacoma International Airport 39.34 in a year, which is below Washington's state average. Mobile, Alabama, records 67.08 in and New Orleans airport 63.35 in. But Sea-Tac logs 156.2 days a year with at least 0.01 in of precipitation, against 117.1 in Mobile and 115.1 in New Orleans. Days with an inch or more go the other way: 5.6 in Seattle, 21.2 in Mobile, 20.1 in New Orleans. Seattle gets frequent light rain; the Gulf Coast gets fewer, much heavier downpours.
The soaked Washington of the postcards is real, just not in Seattle. Quillayute airport, near the Pacific coast of the Olympic Peninsula, averages 101.32 in a year over 203.1 wet days. To the south and inland, the Hoh River valley holds the temperate rain forest described in our guide to the Hoh Rainforest.

Washington's year is also lopsided. October to January brings 54% of its average total, while July and August together bring 4%. Wet, drizzly winters and dry summers help make the state feel wetter than its total suggests.
Rain or precipitation: what these totals include
Strictly, this ranking is of precipitation, not rain. The National Weather Service defines precipitation as water that condenses in the air and falls "as rain, sleet, snow, hail, etc." (NWS glossary). Gauges melt whatever lands in them, so a state's total counts snow as the water it contains, not as its depth. Sea-Tac's normal snowfall, 6.3 in a year, enters the 39.34 in total only as the much smaller amount of water it melts down to.
That matters for snowy states, where part of the total arrives in winter as snow, and it matters very little along the Gulf: New Orleans airport's normal snowfall is 0.0 in. NOAA does not publish rain-only state totals, so this ranking uses total precipitation, the measure NOAA does publish.
The state figures are also averages over area, not readings from one place. For the contiguous states and Alaska, NCEI builds them from a 5 km grid interpolated from station data (its documentation); Hawaii's come from the University of Hawai‘i's 250 m rainfall grids, so a mountainous state's average blends wet slopes with dry valleys. That is why a single city can be far wetter or drier than its state's figure.
The Gulf Coast belt, from Louisiana to Tennessee
Among the 48 contiguous states, the top four sit in one block: Louisiana, Mississippi, Alabama and Tennessee. Florida and Arkansas complete a run of six neighbours, and Kentucky, Georgia and North Carolina border it. An independent grid from Oregon State University, PRISM, puts these contiguous states in the same order (see the method below).
Louisiana's rain is unusually even through the year. Its wettest month on the 1991–2020 averages is January, at 5.66 in, and its driest, October, still brings 4.47 in, 44% of what Nevada gets in a whole year. Over a full year Louisiana gets 5.9 times Nevada's total.
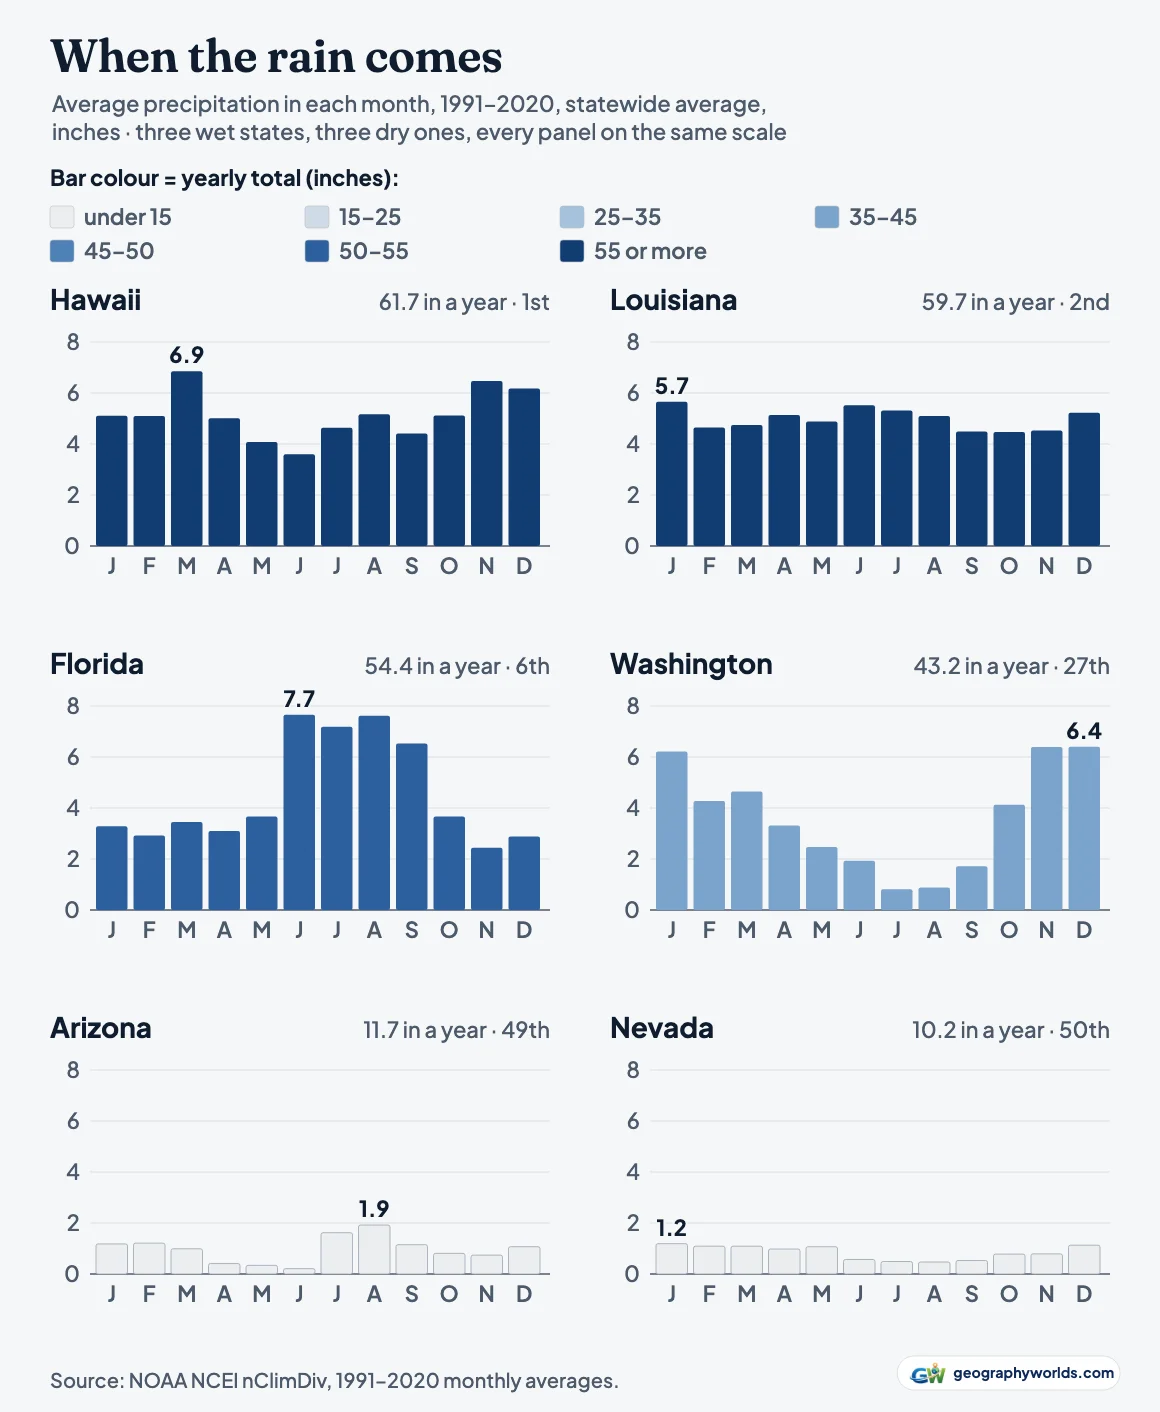
Florida has a different calendar. June to September brings 53% of its yearly total, with June the wettest month at 7.66 in. From May to October it gets 36.3 in against Louisiana's 29.8; from November to April, 18.1 in against 30.0.
Single years can reorder the list. In 2025, the latest complete year, the wettest state was Kentucky, with 57.49 in, its 10th-wettest year in a 131-year record, ahead of Tennessee (53.42) and Louisiana (53.05). NCEI's annual national climate report records the same tenth place for Kentucky.
Hawaii: first place on a short, uneven record
Hawaii's statewide series is the newest in NCEI's set. It starts in 1991; Alaska's starts in 1925 and the contiguous states' in 1895. Hawaii was the last state to be given official climate divisions, twelve of them, set out in a 2024 paper in the Bulletin of the American Meteorological Society. Their 1991–2020 averages run from 140.3 in in the Hilo division on the windward side of Hawai‘i Island down to 17.2 in in Leeward Kohala.
The extremes inside those divisions are larger still. The Rainfall Atlas of Hawai‘i maps 1978–2007 averages from 204 mm (8 in) near the summit of Mauna Kea to 10,271 mm (404 in) near Big Bog on the windward slope of Haleakalā, Maui. The airport station at Hilo averages 120.39 in, with measurable rain on 273.0 days a year.
Hawaii's lead is also narrow. It is ahead of Louisiana by 2.0 in on average, and in a dry year it falls far down the list. 2025 brought Hawaii 41.96 in, its third-driest year since 1991, and that total ranked only 16th among the states. Its wettest year in the series, 2018, brought 97.98 in. Averaging the atlas's own 1978–2007 grid over the islands gives about 70.6 in, higher than NCEI's 1991–2020 figure, which fits the slow decline in Hawaiian rainfall that the atlas paper describes.
Alaska, the other state outside the contiguous 48, is 30th at 37.6 in.
Where the West runs dry
The five driest states, Nevada, Arizona, Utah, New Mexico and Wyoming, form one block across the interior West, and Colorado, Montana and North Dakota are only slightly wetter. Nevada lies in the lee of the Sierra Nevada and averages 10.2 in (259 mm); in 2025 it had 9.41 in. Las Vegas airport, a single station, records 4.18 in over 25.8 wet days a year. The driest climate division anywhere in NOAA's set is Arizona's Southwest division, in the state's far southwestern corner, at 5.1 in.
Arizona's rain has a season. July to September brings 40% of its yearly total, with August the wettest month, the signature of the North American monsoon, which the National Weather Service in Tucson says typically arrives over the southwest US in early July. Nevada has no such summer peak; its wettest month is January. Temperature is a different ranking with a different order, set out from the same NOAA series in our list of the hottest states in the US.
The Pacific coast is not a wet coast overall. California, at 22.3 in, is 41st, and Oregon, at 32.1 in, is 35th, below Washington but above Kansas and Texas.
All 50 states, wettest to driest
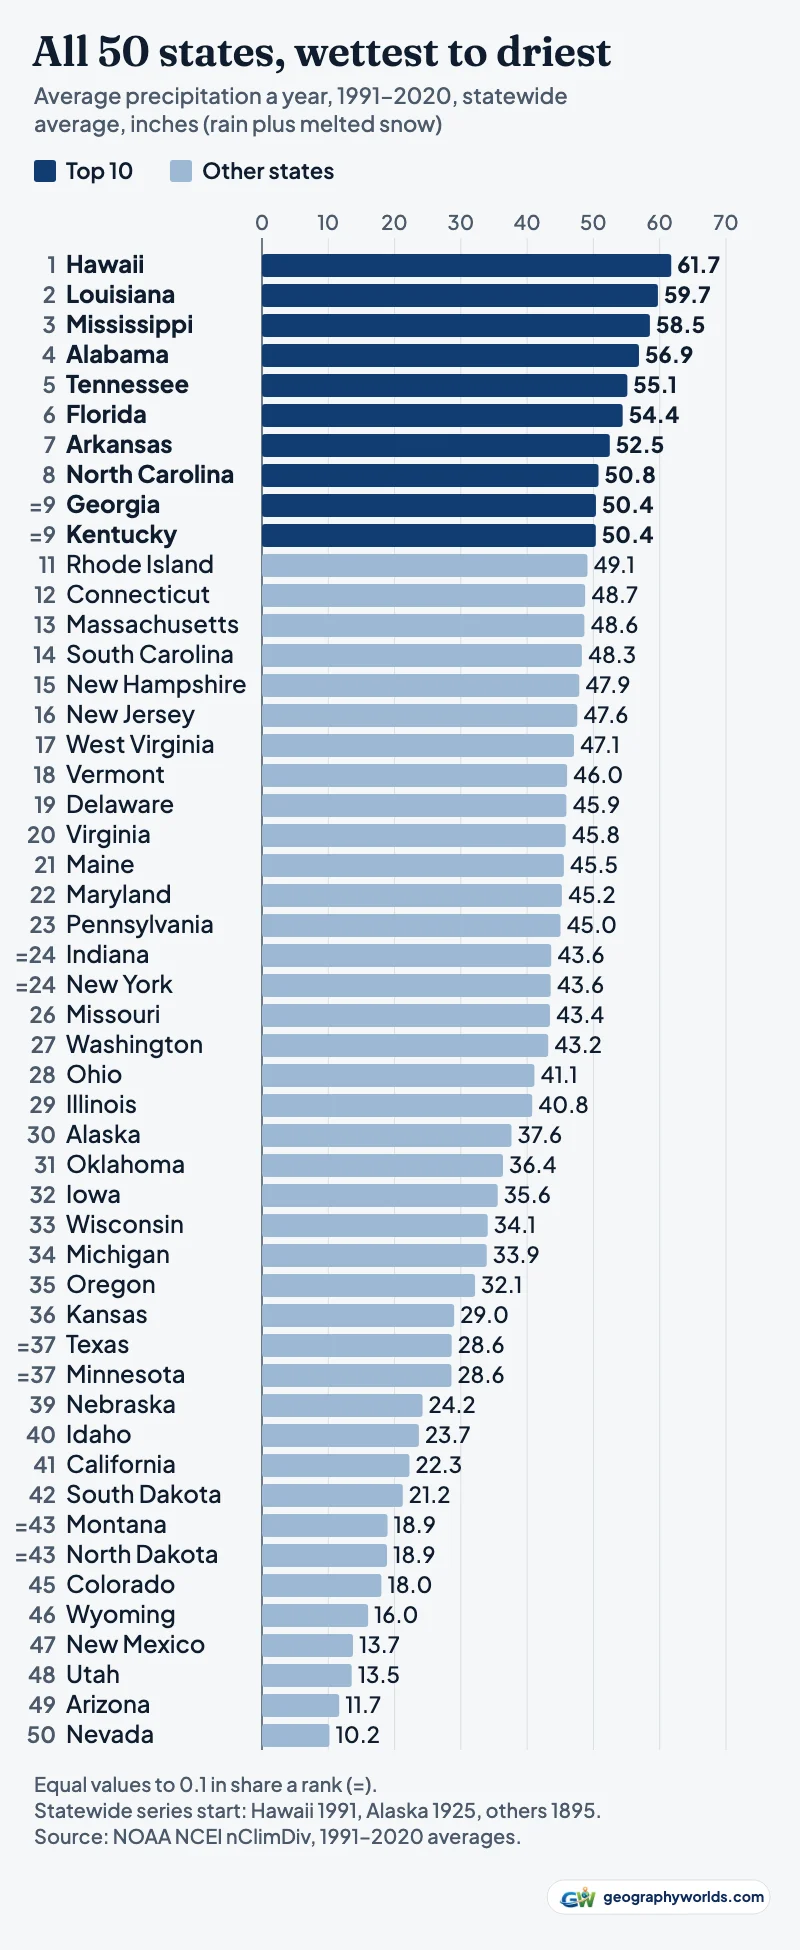
The table ranks every state by its 1991–2020 average shown to a tenth of an inch, with equal values sharing a rank, so Georgia and Kentucky are both ninth and Indiana and New York both 24th. The last column is each state's 2025 total.
| Rank | State | Inches a year, 1991–2020 | mm | 2025 (in) |
|---|---|---|---|---|
| 1 | Hawaii | 61.7 | 1,568 | 42.0 |
| 2 | Louisiana | 59.7 | 1,517 | 53.1 |
| 3 | Mississippi | 58.5 | 1,486 | 52.4 |
| 4 | Alabama | 56.9 | 1,444 | 51.8 |
| 5 | Tennessee | 55.1 | 1,400 | 53.4 |
| 6 | Florida | 54.4 | 1,382 | 44.7 |
| 7 | Arkansas | 52.5 | 1,333 | 51.6 |
| 8 | North Carolina | 50.8 | 1,290 | 44.6 |
| =9 | Georgia | 50.4 | 1,280 | 44.1 |
| =9 | Kentucky | 50.4 | 1,279 | 57.5 |
| 11 | Rhode Island | 49.1 | 1,247 | 44.8 |
| 12 | Connecticut | 48.7 | 1,238 | 41.9 |
| 13 | Massachusetts | 48.6 | 1,235 | 42.9 |
| 14 | South Carolina | 48.3 | 1,226 | 43.1 |
| 15 | New Hampshire | 47.9 | 1,216 | 40.0 |
| 16 | New Jersey | 47.6 | 1,208 | 38.9 |
| 17 | West Virginia | 47.1 | 1,196 | 45.1 |
| 18 | Vermont | 46.0 | 1,169 | 42.0 |
| 19 | Delaware | 45.9 | 1,166 | 40.3 |
| 20 | Virginia | 45.8 | 1,164 | 43.4 |
| 21 | Maine | 45.5 | 1,157 | 38.9 |
| 22 | Maryland | 45.2 | 1,149 | 38.4 |
| 23 | Pennsylvania | 45.0 | 1,144 | 40.3 |
| =24 | Indiana | 43.6 | 1,108 | 39.9 |
| =24 | New York | 43.6 | 1,106 | 40.2 |
| 26 | Missouri | 43.4 | 1,103 | 38.1 |
| 27 | Washington | 43.2 | 1,097 | 40.0 |
| 28 | Ohio | 41.1 | 1,044 | 39.1 |
| 29 | Illinois | 40.8 | 1,035 | 33.0 |
| 30 | Alaska | 37.6 | 956 | 39.1 |
| 31 | Oklahoma | 36.4 | 924 | 39.5 |
| 32 | Iowa | 35.6 | 903 | 33.6 |
| 33 | Wisconsin | 34.1 | 865 | 30.6 |
| 34 | Michigan | 33.9 | 861 | 32.0 |
| 35 | Oregon | 32.1 | 816 | 29.1 |
| 36 | Kansas | 29.0 | 736 | 29.5 |
| =37 | Texas | 28.6 | 727 | 26.0 |
| =37 | Minnesota | 28.6 | 726 | 26.6 |
| 39 | Nebraska | 24.2 | 615 | 24.3 |
| 40 | Idaho | 23.7 | 601 | 23.2 |
| 41 | California | 22.3 | 565 | 23.3 |
| 42 | South Dakota | 21.2 | 539 | 23.3 |
| =43 | Montana | 18.9 | 481 | 20.0 |
| =43 | North Dakota | 18.9 | 479 | 19.9 |
| 45 | Colorado | 18.0 | 457 | 16.0 |
| 46 | Wyoming | 16.0 | 407 | 16.3 |
| 47 | New Mexico | 13.7 | 349 | 12.5 |
| 48 | Utah | 13.5 | 344 | 10.4 |
| 49 | Arizona | 11.7 | 296 | 9.8 |
| 50 | Nevada | 10.2 | 259 | 9.4 |
You can download the data as a CSV, with all twelve monthly averages for every state, its 2025 total and rank, and the year its series begins; a table of fifty states by twelve months turns into small multiples of your own in Parity.
Sources and method
State figures are NCEI's nClimDiv statewide precipitation files dated 6 October 2026: 1991–2020 averages from its averages file (period code 0010), checked against the mean of the thirty yearly totals computed from the monthly series; all fifty states agree within 0.05 in. Station figures are NCEI's 1991–2020 station normals and are never mixed into the state ranking. As a check from outside NOAA, area-averaging Oregon State University's PRISM 1991–2020 grid gives the same top nine contiguous states in the same order and the same driest five; PRISM puts Washington 23rd of the 48 rather than 26th, so its exact place depends on the dataset.
- NOAA NCEI, Monthly U.S. Climate Divisional Database (nClimDiv): statewide precipitation (climdiv-pcpnst) and statewide/divisional 1991–2020 averages (climdiv-norm-pcpnst, climdiv-norm-pcpndv): inches, area-weighted state averages of a 5 km grid built from station data (Hawaii: from the University of Hawai‘i / Hawai‘i Climate Data Portal 250 m rainfall grids, per Luo et al. 2024); contiguous states from 1895, Alaska from 1925, Hawaii from 1991; files of 6 October 2026; US government work, free download (doi:10.7289/V5M32STR)
- NOAA NCEI, Climate at a Glance: statewide time series: the same nClimDiv series, browsable by state
- NOAA NCEI, U.S. Climate Normals 1991–2020, annual/seasonal station normals: Seattle–Tacoma, Quillayute, New Orleans, Mobile, Las Vegas and Hilo airports: precipitation, days with ≥0.01 in and ≥1 in
- NOAA NCEI, climate division boundaries (CONUS_CLIMATE_DIVISIONS.shp.zip): division names for Washington
- Luo, Frazier, Diaz, Longman and Giambelluca (2024), Routine Climate Monitoring in the State of Hawai‘i: Establishment of State Climate Divisions, BAMS: Hawaii's 12 climate divisions (Table 1)
- Giambelluca et al. (2013), Online Rainfall Atlas of Hawai‘i, BAMS 94, 313–316: 1978–2007 mean annual rainfall maps; range 204 mm to 10,271 mm
- NOAA NCEI, Annual 2025 National Climate Report: 2025 state rankings for Kentucky and Hawaii
- National Weather Service glossary: precipitation: definition
- National Weather Service Tucson, Monsoon education: monsoon arrival in the southwest US
- US state outlines: us-atlas 3.0.1 (US Census Bureau cartographic boundaries): ISC licence; boundaries public domain
To set Hawaii's 61.7 in against whole nations, many of them in the tropics, turn to our ranking of the wettest countries in the world.