
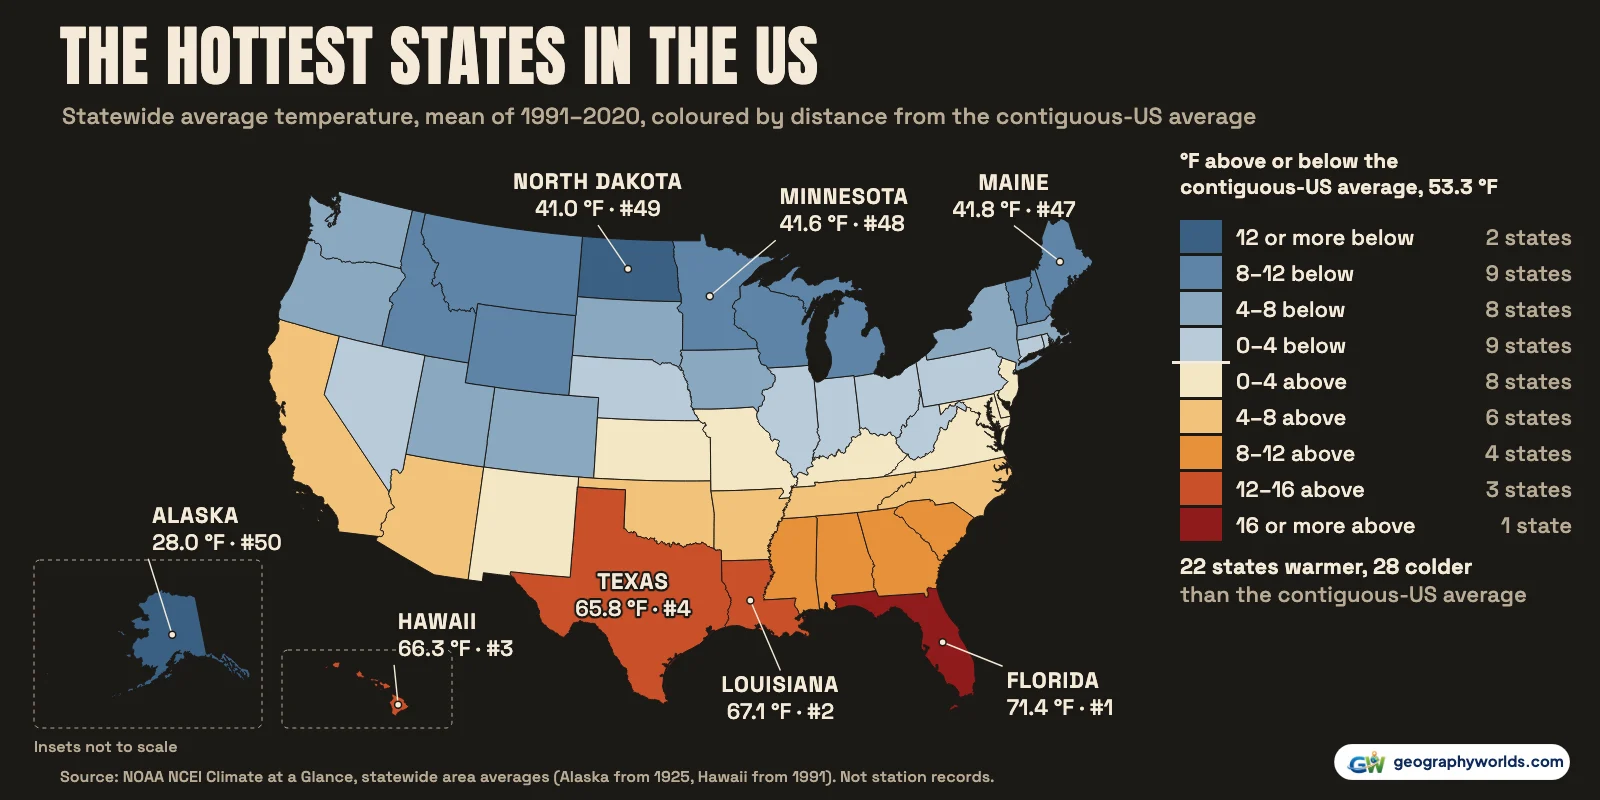
Florida is the hottest state in the US. On NOAA's statewide temperature records it averaged 71.4 °F (21.9 °C) over 1991–2020, 4.3 °F warmer than second-placed Louisiana (67.1 °F). Hawaii (66.3 °F) is third and Texas (65.8 °F) fourth, with Georgia and Mississippi level at 64.2 °F. The coldest state is Alaska at 28.0 °F (−2.2 °C). In the lower 48 the coldest are North Dakota (41.0 °F), Minnesota (41.6 °F) and Maine (41.8 °F). Florida also had the highest average in 2025, at 72.3 °F. The ranking changes if you ask about summer afternoons instead: Texas and Arizona are the hottest states then, and Florida comes 5th.
Every figure here is a statewide area average from NOAA's National Centers for Environmental Information (NCEI). Each one is a temperature averaged over the whole map of a state, mountains and swamps included, month by month, back to 1895 for the contiguous states. It is not the reading at one airport, and it is not a record. The single highest readings ever taken in each state are a separate question, and they get their own table below. Against the contiguous-US average of 53.3 °F (11.8 °C), 22 states are warmer and 28 colder.
Is Florida really the hottest state?
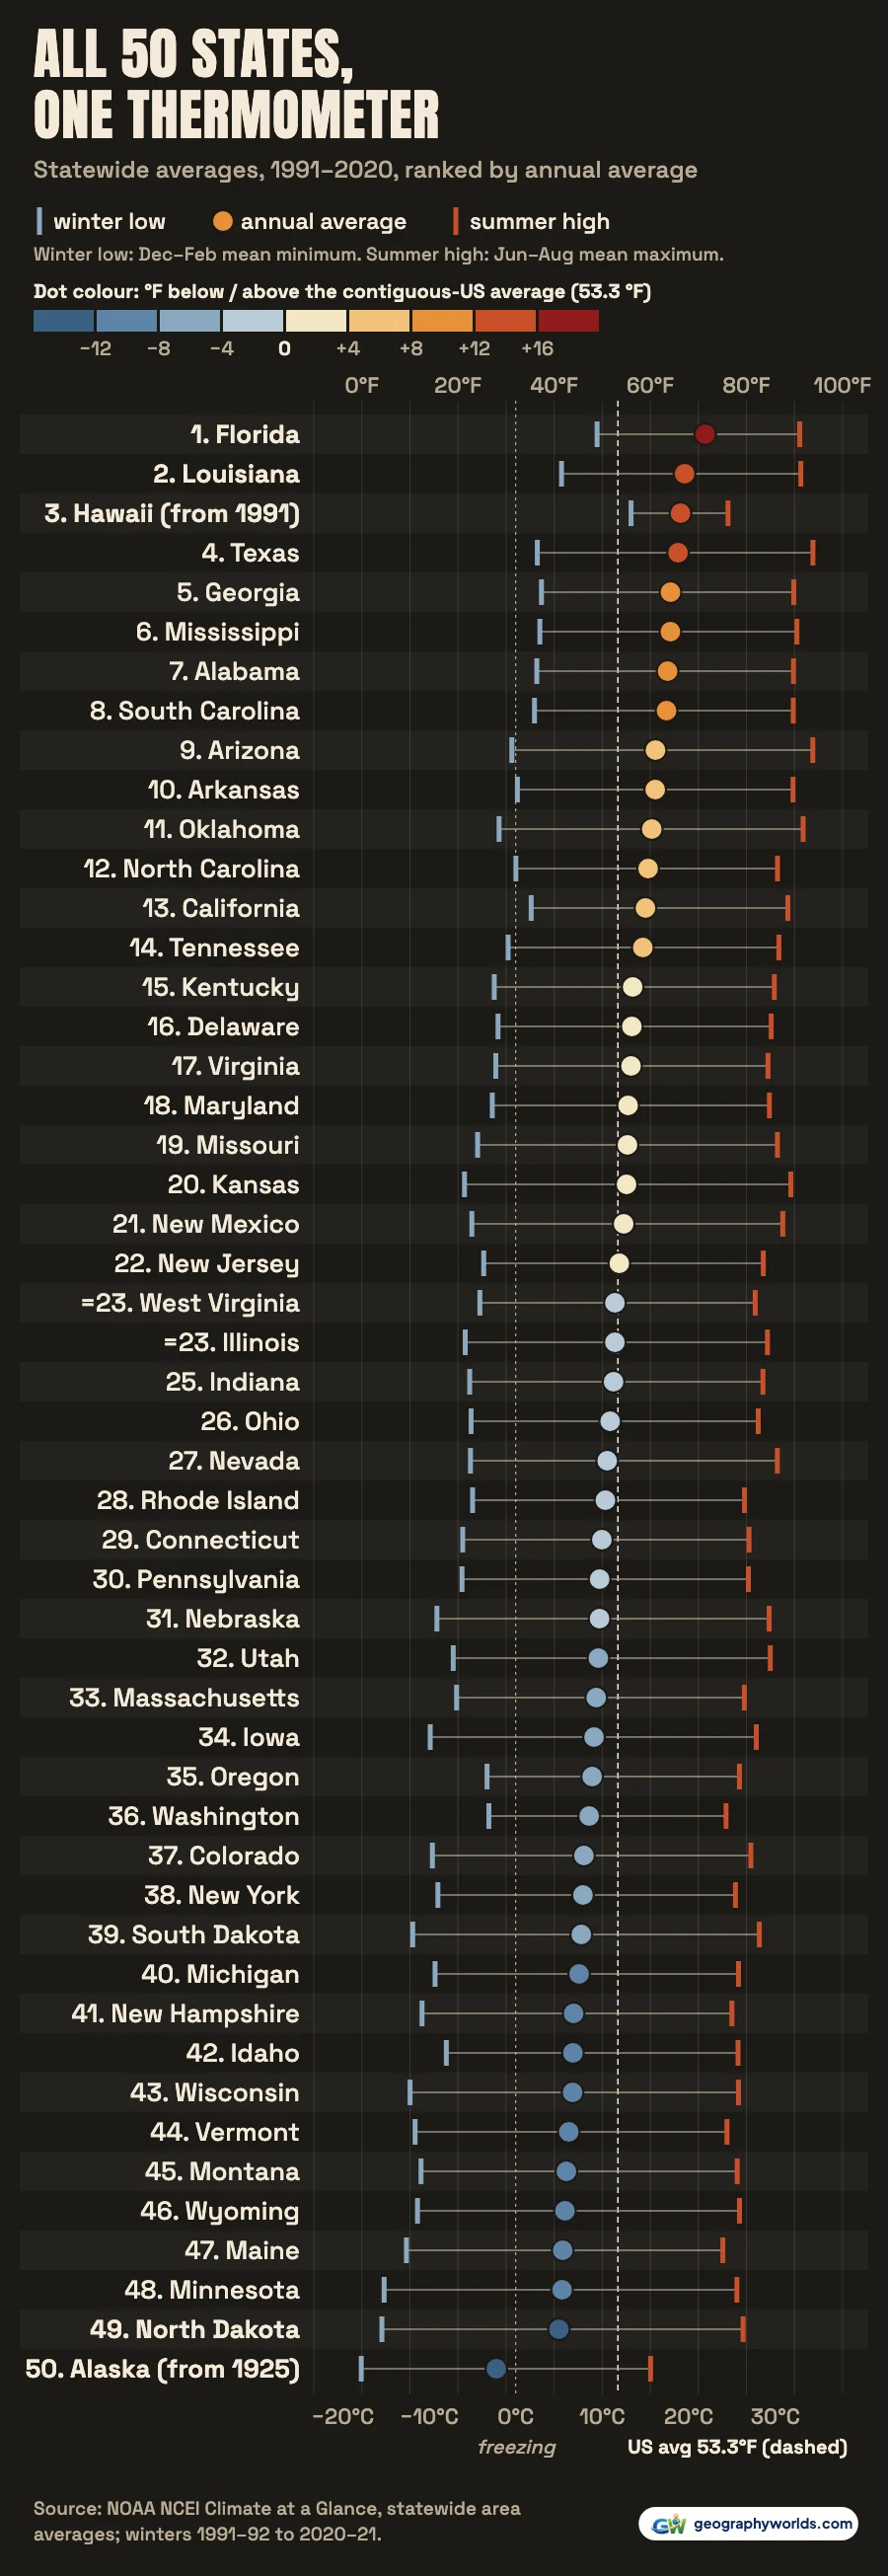
Yes, and by a wide margin. Florida's lead of 4.3 °F over Louisiana is bigger than the whole gap between Louisiana and Alabama, the seventh state on the list. The difference is in winter. Over 1991–2020 its winter nights, the December–February mean minimum, averaged 48.9 °F. Only Hawaii's were warmer. Louisiana's winter nights averaged 41.5 °F and Texas's 36.5 °F.
Florida keeps the title from year to year as well. In 2025 it averaged 72.3 °F. The Florida Climate Center's annual summary gives the same figure and ranks the year as Florida's 11th-warmest since 1895. The warmest year in the state's record is still 2015, at 73.4 °F. Louisiana (68.6 °F), Texas (67.8 °F) and Hawaii (67.0 °F) followed Florida in 2025.

Why does Hawaii come third and not second?
Hawaii's beaches are warm, but a statewide average also counts its high ground, and the volcano summits are cold: the state's record low, 12 °F, was set at the Mauna Kea Observatory. That pulls Hawaii's area average down to 66.3 °F (19.0 °C), just behind Louisiana. Hawaii's record is also short. NCEI's Hawaii series begins in 1991, so for Hawaii the 1991–2020 average covers the first 30 years of its record, which runs to 2025. Alaska's begins in 1925, and the other 48 states' in 1895.
What sets Hawaii apart is how little its temperature changes through the year. Its winter nights are the mildest in the country, averaging 56.0 °F. Its summer afternoons average 76.2 °F, 46th of the 50 states. Only Alaska, Maine, Vermont and Washington have cooler summer highs. In 2025 Hawaii averaged 67.0 °F, +0.7 °F against its 1991–2020 average and the 6th-warmest year in its series. The University of Hawaiʻi's first annual climate report also ranks 2025 sixth.
| Rank | State | Average 1991–2020, °F (°C) | 2025, °F | 2025 rank | Summer high, °F | Winter low, °F | Record begins |
|---|---|---|---|---|---|---|---|
| 1 | Florida | 71.4 (21.9) | 72.3 | 1 | 91.1 | 48.9 | 1895 |
| 2 | Louisiana | 67.1 (19.5) | 68.6 | 2 | 91.3 | 41.5 | 1895 |
| 3 | Hawaii | 66.3 (19.0) | 67.0 | 4 | 76.2 | 56.0 | 1991 |
| 4 | Texas | 65.8 (18.8) | 67.8 | 3 | 93.8 | 36.5 | 1895 |
| 5 | Georgia | 64.2 (17.9) | 64.9 | 6 | 89.8 | 37.4 | 1895 |
| 6 | Mississippi | 64.2 (17.9) | 65.9 | 5 | 90.5 | 37.0 | 1895 |
| 7 | Alabama | 63.6 (17.6) | 64.5 | 7 | 89.8 | 36.4 | 1895 |
| 8 | South Carolina | 63.4 (17.4) | 63.7 | 8 | 89.7 | 35.9 | 1895 |
| 9 | Arizona | 61.1 (16.2) | 62.8 | 9 | 93.8 | 31.2 | 1895 |
| 10 | Arkansas | 61.0 (16.1) | 62.6 | 10 | 89.7 | 32.4 | 1895 |
| 11 | Oklahoma | 60.3 (15.7) | 61.5 | 11 | 91.8 | 28.5 | 1895 |
| 12 | North Carolina | 59.6 (15.3) | 60.0 | 13 | 86.5 | 32.0 | 1895 |
| 13 | California | 59.0 (15.0) | 60.4 | 12 | 88.6 | 35.2 | 1895 |
| 14 | Tennessee | 58.4 (14.7) | 59.5 | 14 | 86.8 | 30.4 | 1895 |
| 15 | Kentucky | 56.3 (13.5) | 57.2 | 15 | 85.8 | 27.5 | 1895 |
| 16 | Delaware | 56.2 (13.4) | 56.1 | 19 | 85.1 | 28.3 | 1895 |
| 17 | Virginia | 56.0 (13.3) | 56.5 | 17 | 84.5 | 27.9 | 1895 |
| 18 | Maryland | 55.4 (13.0) | 55.7 | 21 | 84.8 | 27.1 | 1895 |
| 19 | Missouri | 55.2 (12.9) | 56.5 | 16 | 86.4 | 24.1 | 1895 |
| 20 | Kansas | 55.1 (12.8) | 56.0 | 20 | 89.2 | 21.4 | 1895 |
| 21 | New Mexico | 54.5 (12.5) | 56.2 | 18 | 87.6 | 22.9 | 1895 |
| 22 | New Jersey | 53.6 (12.0) | 53.8 | 22 | 83.5 | 25.3 | 1895 |
| =23 | West Virginia | 52.6 (11.5) | 53.1 | 25 | 81.8 | 24.6 | 1895 |
| =23 | Illinois | 52.6 (11.5) | 53.6 | 23 | 84.4 | 21.5 | 1895 |
| 25 | Indiana | 52.4 (11.3) | 52.8 | 26 | 83.4 | 22.4 | 1895 |
| 26 | Ohio | 51.7 (10.9) | 51.9 | 27 | 82.5 | 22.7 | 1895 |
| 27 | Nevada | 51.0 (10.6) | 53.2 | 24 | 86.4 | 22.6 | 1895 |
| 28 | Rhode Island | 50.7 (10.4) | 51.1 | 29 | 79.6 | 23.0 | 1895 |
| 29 | Connecticut | 49.9 (10.0) | 50.4 | 31 | 80.5 | 21.0 | 1895 |
| 30 | Pennsylvania | 49.5 (9.7) | 49.6 | 34 | 80.4 | 20.8 | 1895 |
| 31 | Nebraska | 49.4 (9.7) | 51.0 | 30 | 84.7 | 15.6 | 1895 |
| 32 | Utah | 49.2 (9.6) | 51.8 | 28 | 85.0 | 19.0 | 1895 |
| 33 | Massachusetts | 48.8 (9.3) | 49.2 | 35 | 79.6 | 19.7 | 1895 |
| 34 | Iowa | 48.3 (9.1) | 49.7 | 33 | 82.1 | 14.2 | 1895 |
| 35 | Oregon | 47.9 (8.8) | 49.8 | 32 | 78.5 | 26.0 | 1895 |
| 36 | Washington | 47.3 (8.5) | 49.1 | 36 | 75.8 | 26.4 | 1895 |
| 37 | Colorado | 46.2 (7.9) | 47.7 | 37 | 80.9 | 14.7 | 1895 |
| 38 | New York | 46.0 (7.8) | 46.3 | 39 | 77.7 | 15.8 | 1895 |
| 39 | South Dakota | 45.6 (7.6) | 47.0 | 38 | 82.7 | 10.6 | 1895 |
| 40 | Michigan | 45.2 (7.3) | 45.7 | 41 | 78.3 | 15.2 | 1895 |
| 41 | New Hampshire | 44.1 (6.7) | 44.5 | 43 | 77.0 | 12.5 | 1895 |
| 42 | Idaho | 43.9 (6.6) | 45.9 | 40 | 78.3 | 17.6 | 1895 |
| 43 | Wisconsin | 43.8 (6.6) | 44.6 | 42 | 78.3 | 10.0 | 1895 |
| 44 | Vermont | 43.0 (6.1) | 43.6 | 46 | 75.9 | 11.1 | 1895 |
| 45 | Montana | 42.5 (5.9) | 43.9 | 45 | 78.1 | 12.3 | 1895 |
| 46 | Wyoming | 42.3 (5.7) | 44.1 | 44 | 78.5 | 11.6 | 1895 |
| 47 | Maine | 41.8 (5.4) | 42.3 | 48 | 75.1 | 9.3 | 1895 |
| 48 | Minnesota | 41.6 (5.4) | 42.9 | 47 | 78.0 | 4.6 | 1895 |
| 49 | North Dakota | 41.0 (5.0) | 42.0 | 49 | 79.3 | 4.2 | 1895 |
| 50 | Alaska | 28.0 (−2.2) | 29.6 | 50 | 60.0 | −0.1 | 1925 |
What about summer highs?
If "hottest" means the heat of a summer afternoon, the answer moves west. The June–August mean maximum, averaged over 1991–2020, was 93.8 °F in Texas and 93.8 °F in Arizona, a dead heat when rounded to a tenth of a degree; Texas leads by 0.03 °F. Oklahoma (91.8 °F) and Louisiana (91.3 °F) come next, then Florida (91.1 °F). Arizona is only 9th on the annual average, at 61.1 °F. Its nights are much cooler than its days: its winter nights average 31.2 °F, colder than Georgia's or Alabama's. Nevada shows the same split: its summer highs average 86.4 °F, but it ranks 27th for the year as a whole, at 51.0 °F. California is 13th at 59.0 °F. Its statewide average covers the Sierra Nevada as well as the Mojave Desert.
Record highs tell a different story
A state's average and its record high answer different questions, and they often disagree. NOAA's State Climate Extremes Committee keeps the official all-time readings. Florida's record is 109 °F, at Monticello on 29 June 1931. Of the other 49 states, 39 have higher records. North Dakota, 41.0 °F on average, holds a record of 121 °F, set at Steele on 6 July 1936, and a record low of −60 °F. The highest of all is California's 134 °F at Greenland Ranch, now Furnace Creek, in Death Valley in 1913. The World Meteorological Organization lists it as the hottest temperature recorded anywhere on Earth. Alaska and Hawaii share the lowest record high, 100 °F.
| State | Average rank | Record high, °F | Where and when | Record low, °F |
|---|---|---|---|---|
| Florida | 1 | 109 | Monticello, 29 June 1931 | −2 |
| Louisiana | 2 | 114 | Plain Dealing 4W, 10 August 1936 | −16 |
| Hawaii | 3 | 100 | Pahala (Hawaii), 27 April 1931 | 12 |
| Texas | 4 | 120 | tied at 2 readings; first Seymour, 12 August 1936 | −23 |
| Arizona | 9 | 128 | Lake Havasu City, 29 June 1994 | −40 |
| California | 13 | 134 | Greenland Ranch, 10 July 1913 | −45 |
| North Dakota | 49 | 121 | Steele, 6 July 1936 | −60 |
| Minnesota | 48 | 115 | Beardsley, 29 July 1917 | −60 |
| Maine | 47 | 105 | tied at 2 readings; first North Bridgton, 4 July 1911 | −50 |
| Alaska | 50 | 100 | Fort Yukon, 27 June 1915 | −80 |

Death Valley's extremes, and why the valley floor gets so hot, are covered in our Death Valley National Park guide.
The cold end: Alaska, then the northern Plains
Alaska's statewide average of 28.0 °F is 13.0 °F below North Dakota's. Across all 50 states, the gap from Florida to Alaska is 43.4 °F. Alaska's winter nights average −0.1 °F, below zero, and its summer highs average 60.0 °F. The coldest reading ever accepted for any state is −80 °F, at Prospect Creek Camp on 23 January 1971. Alaska also has a record high of 100 °F, set at Fort Yukon on 27 June 1915.
In the lower 48, the bottom three are close: North Dakota 41.0 °F, Minnesota 41.6 °F and Maine 41.8 °F, with Wyoming next at 42.3 °F. The northern Plains are coldest in winter, when North Dakota's nights average 4.2 °F and Minnesota's 4.6 °F. Their summers are not especially cool, though. North Dakota's summer highs average 79.3 °F, warmer than Maine's 75.1 °F, Washington's 75.8 °F or Hawaii's.
Region by region
The South
Seven of the eight warmest states are in the South. Hawaii is the eighth. Below Florida, Louisiana and Texas come Georgia, Mississippi, Alabama (63.6 °F) and South Carolina (63.4 °F), with Arkansas (61.0 °F) and Oklahoma (60.3 °F) close behind. The region also has a cooler upland end. Kentucky averages 56.3 °F, and West Virginia, in the Appalachians, is the South's coldest state at 52.6 °F, level with Illinois for 23rd.
The West
The West holds both ends of the national list: Hawaii, third, and Alaska, last. Arizona and California are its next-warmest states. Then elevation takes over. Utah averages 49.2 °F, Colorado 46.2 °F, Idaho 43.9 °F and Montana 42.5 °F. On the Pacific coast, Oregon (47.9 °F) and Washington (47.3 °F) have winter nights averaging 26.0 °F and 26.4 °F, milder than any Midwestern or Northeastern state's, but cool summer afternoons: Washington's summer highs rank 48th.
The Midwest
Missouri is the warmest Midwestern state at 55.2 °F, with Kansas close behind at 55.1 °F. Nebraska averages 49.4 °F, South Dakota 45.6 °F, Michigan 45.2 °F and Wisconsin 43.8 °F, down to North Dakota at the bottom.
The Northeast
New Jersey is the Northeast's warmest state at 53.6 °F, and the only one above the contiguous-US average of 53.3 °F. Pennsylvania averages 49.5 °F, New York 46.0 °F, Vermont 43.0 °F and Maine, the region's coldest, 41.8 °F. Our guide to the climate of the United States explains the air masses behind these bands.
Warmer at both ends since 1895
Every one of the 48 contiguous states has warmed over its record, the hottest and the coldest alike. On a straight-line trend, Florida has risen 2.3 °F since 1895, about 0.18 °F a decade. NOAA's Florida State Climate Summary similarly says more than 2 °F since the start of the 20th century. The cold states have warmed more. North Dakota is up 3.3 °F, in line with its state summary's "more than 2.6°F", and Maine 3.8 °F. Alaska has warmed 0.33 °F a decade since 1925, a shorter period. Among the contiguous states, Rhode Island is fastest at 0.32 °F a decade over 1895–2025. Alabama, Mississippi and Arkansas have changed least, with Alabama at just 0.03 °F a decade. The contiguous US as a whole is up 2.3 °F on its trend.
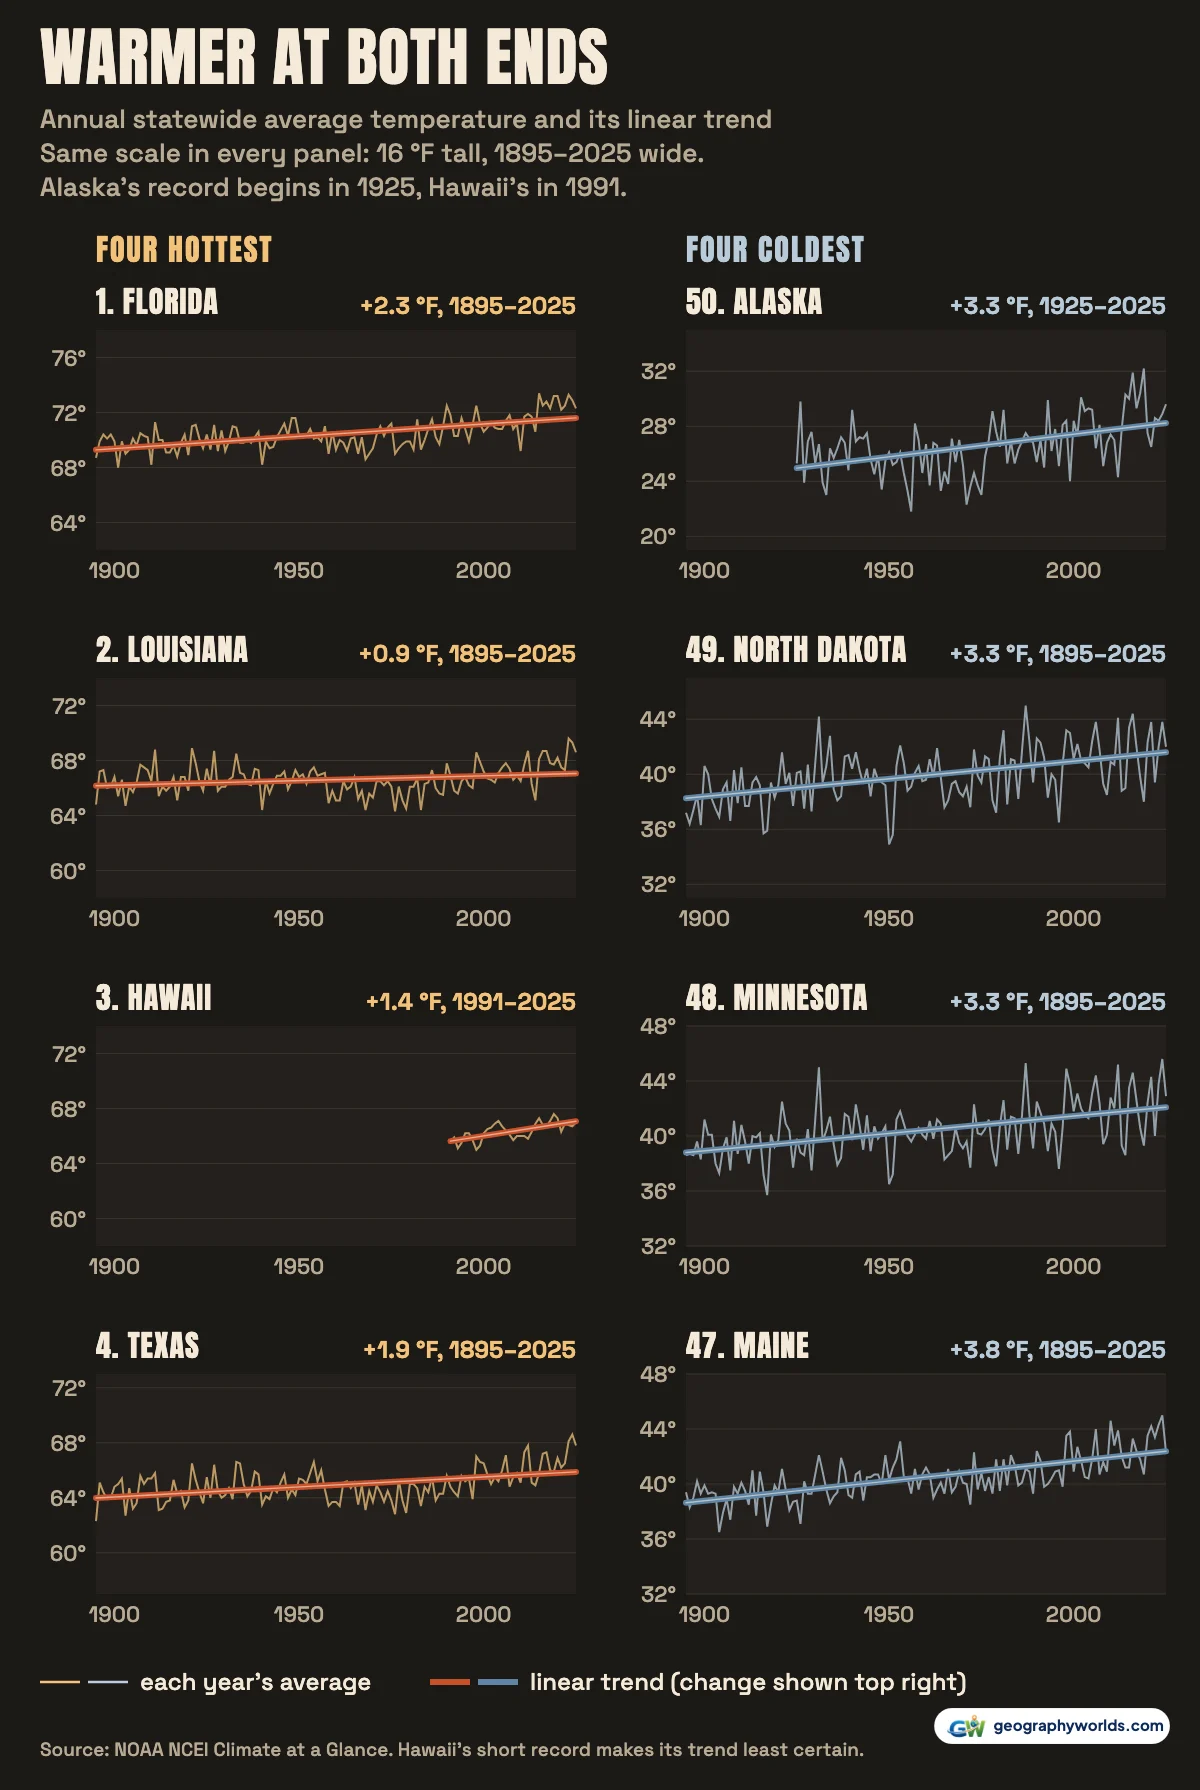
In 2025, every state except Delaware was warmer than its 1991–2020 average. Utah was furthest above, at +2.6 °F, followed by Nevada (+2.2 °F). The contiguous US averaged 54.6 °F, its 4th-warmest year since 1895. Alaska, at 29.6 °F, was +1.6 °F above its average, close to the 1.5 °F that the Alaska Climate Research Center calculates from its own stations.
How the ranking was made
The ranking uses each state's annual average temperature from NCEI's Climate at a Glance statewide series, averaged over 1991–2020. That is a standard 30-year climate window. Summer highs are the June–August mean maximum over the same years. Winter lows are the December–February mean minimum for the winters from 1991–92 to 2020–21. Trends are least-squares lines through each state's annual values. The map's colours are centred on NCEI's contiguous-US average for 1991–2020, 53.3 °F. Conversions to °C are ours. You can download the data as a CSV, with every state's averages, ranks, trend, records and every annual value since 1895. To plot two states' histories against each other, open the file in Parity and pick their rows.
- NOAA National Centers for Environmental Information (NCEI), Climate at a Glance: Statewide Time Series: statewide area-average temperature (nClimDiv), annual, June–August maximum and December–February minimum; contiguous states from 1895, Alaska from 1925, Hawaii from 1991; US government work, listed on data.gov under CC0 1.0 (public domain)
- NOAA NCEI, Climate at a Glance: National Time Series (contiguous US): contiguous-US annual average temperature, the centre of the map's colour scale; public domain
- NOAA NCEI, State Climate Extremes Committee (SCEC) records: all-time maximum and minimum temperature by state, station observations; public domain
- NOAA NCEI, nClimDiv dataset record on data.gov: coverage (Alaska divisions from 1925, Hawaii 1991 onward) and licence (CC0 1.0)
- State outlines: us-atlas 3.0.1 (US Census Bureau cartographic boundaries): Census boundaries are public domain; us-atlas is ISC-licensed
Heat is half of a state's climate. For the other half, see our ranking of the rainiest states in the US, from the same NOAA records.