
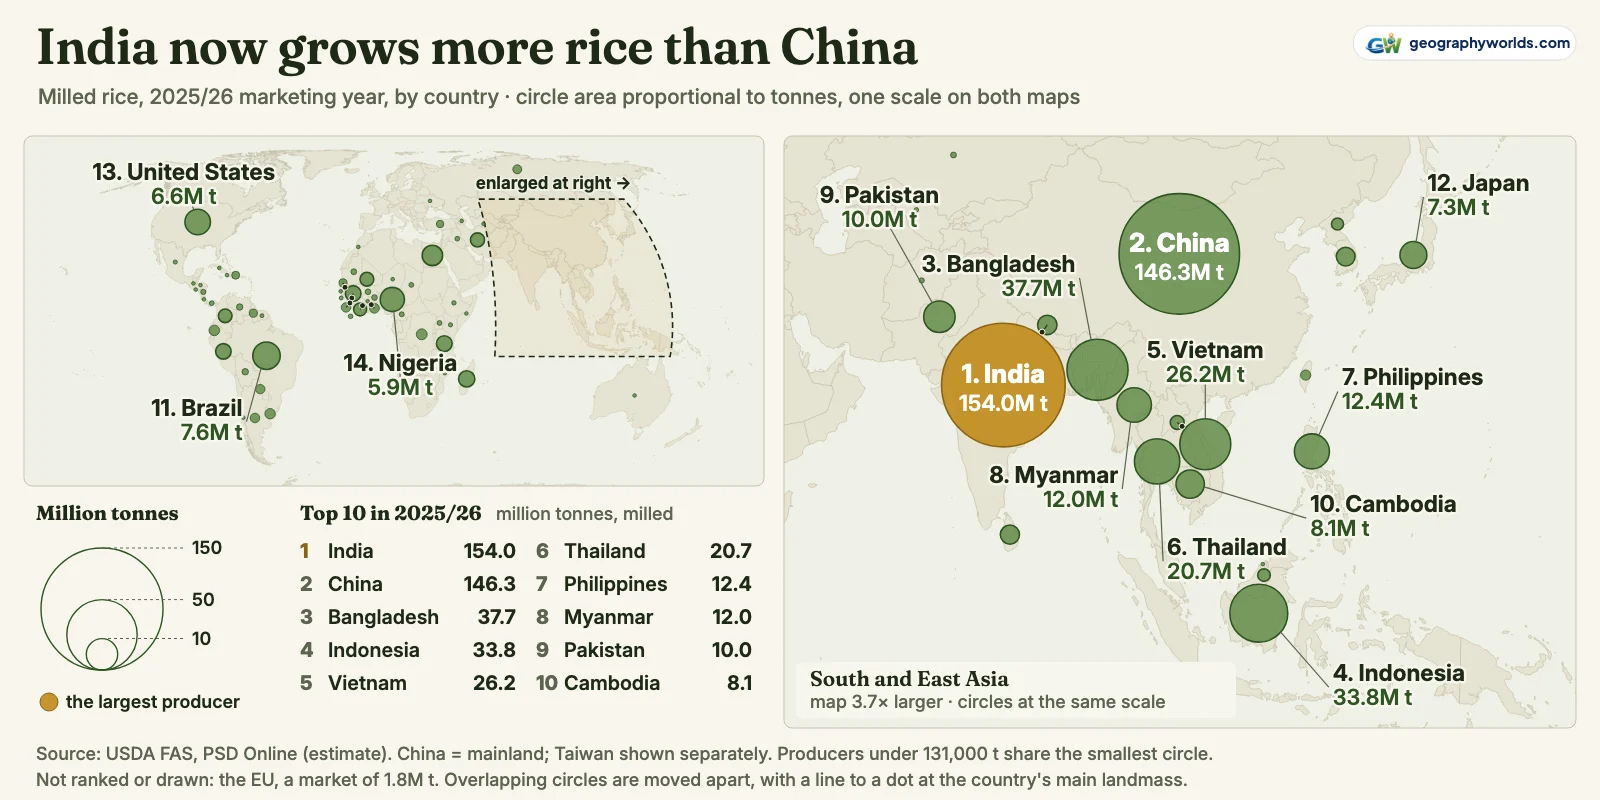
India produces the most rice of any country: 154.0 million tonnes of milled rice in the 2025/26 marketing year, or 28.2% of the world's 545.7 million tonnes, according to estimates from the US Department of Agriculture (USDA). China is second with 146.3 million tonnes (26.8%), followed by Bangladesh (37.7 million), Indonesia (33.8 million), Vietnam (26.2 million), Thailand, the Philippines, Myanmar, Pakistan and Cambodia. Counted before milling, as rough rice still in its husk, the USDA puts India at 231.1 million tonnes and China at 209.0 million: the same order.
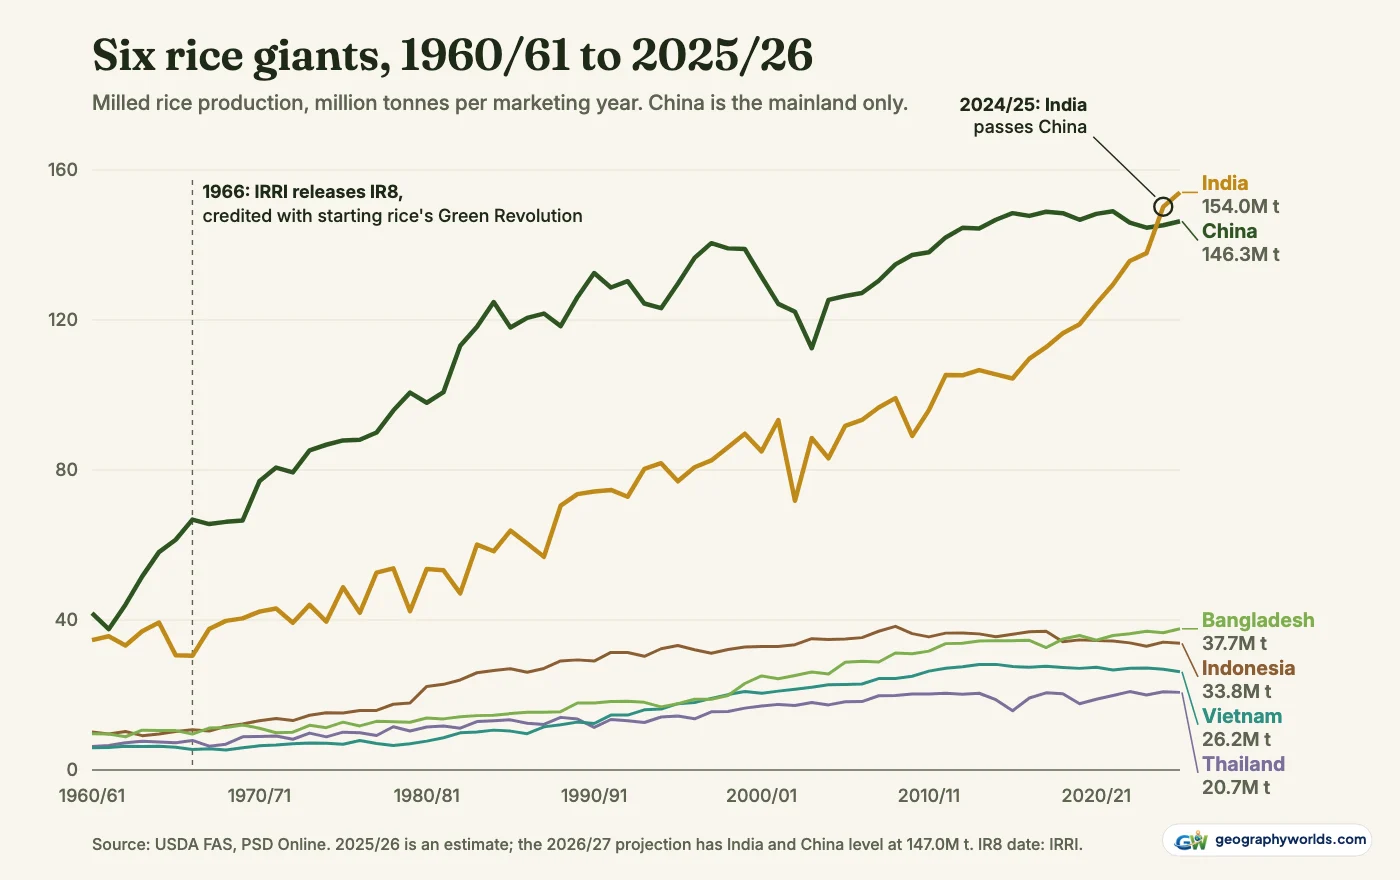
That order is new. In the USDA's series, which begins in 1960/61, China out-produced India on milled rice every year until 2024/25, when India's 150.2 million tonnes passed China's 145.3 million. Adding Taiwan, which the USDA lists separately, does not change that. Together the two countries grow 55% of the world's rice. We rank on milled rice because it is the USDA's own production line and the basis on which India reports its crop; rough rice sits beside it throughout.
1961/62: a near tie, with Japan in third
The series opens with China clearly ahead: 59.7 million tonnes of rough rice in 1960/61 against India's 52.0 million. A year later China's crop had dropped to 53.64 million tonnes, almost exactly level with India's 53.55 million. The gap was 92,000 tonnes, 0.17% of China's crop. On milled rice the same harvests read 37.5 million and 35.7 million, because the USDA applies a higher milling rate to China than to India.
Third place went to Japan, with 11.3 million tonnes of milled rice, ahead of Bangladesh (9.62 million) and Indonesia (9.59 million). Japan earned its place on yield rather than land. Its farmers harvested 4.70 tonnes of rough rice per hectare in 1961/62, the highest of any of that year's ten largest producers and more than double the world average of 1.86 tonnes.
1966: IR8 and the semi-dwarf plant
India's harvest fell from 39.3 million tonnes of milled rice in 1964/65 to 30.6 million in 1965/66 and 30.4 million in 1966/67, when India grew only 17.0% of the world's rice. In November 1966, the International Rice Research Institute in the Philippines released IR8. According to IRRI's own history of the variety, it came from a 1962 cross between Dee-geo-woo-gen, a dwarf variety from Taiwan, and Peta, a tall one from Indonesia. IRRI credits the semi-dwarf IR8 with jumpstarting the Green Revolution in rice.
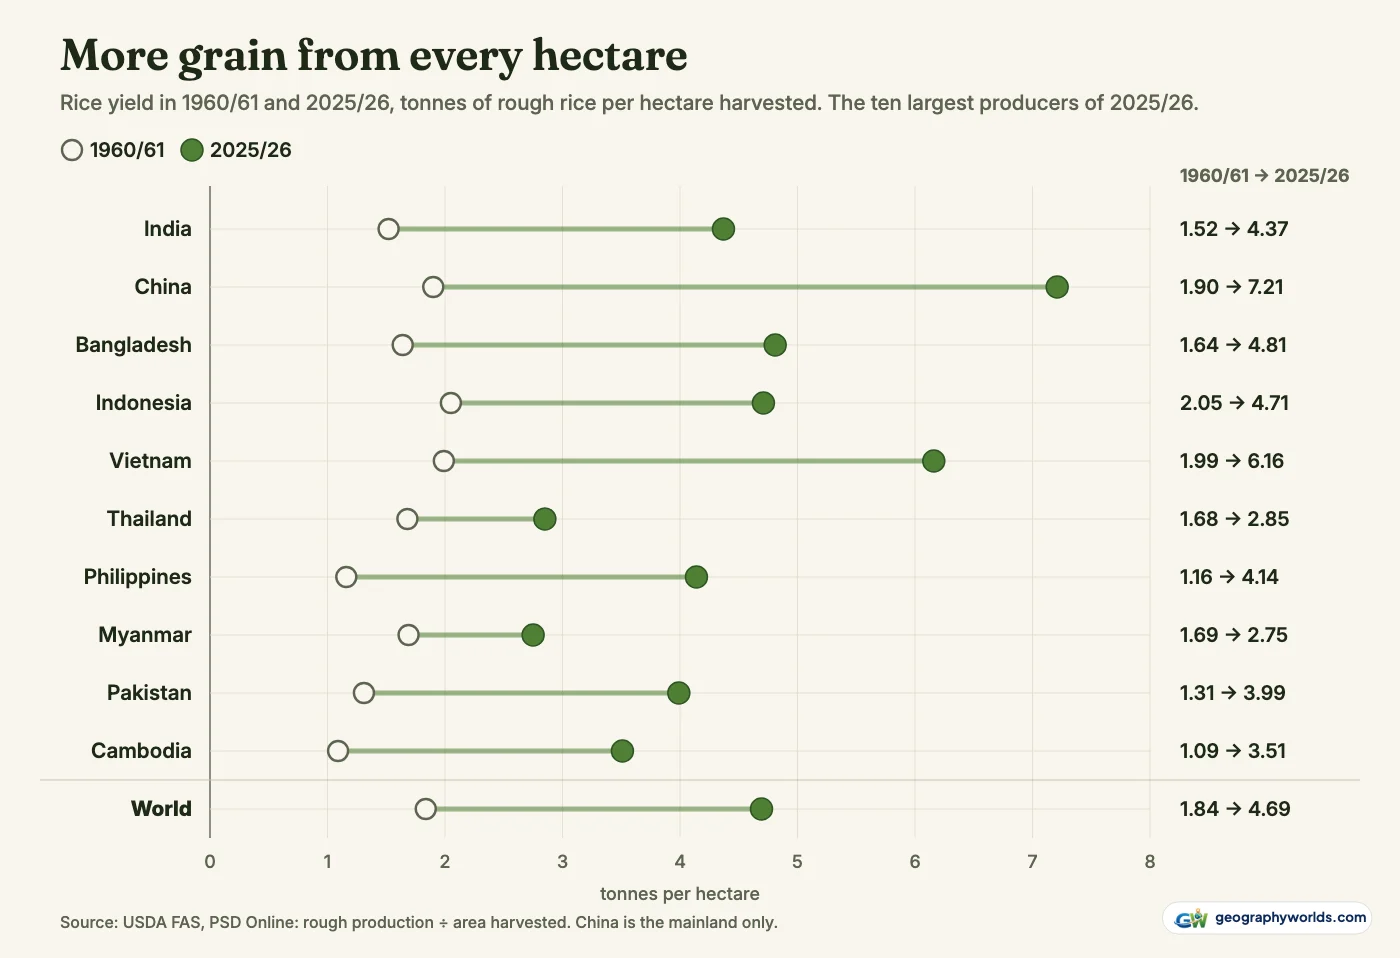
The yield chart below shows what followed. The world average rose from 1.84 tonnes of rough rice per hectare in 1960/61 to 2.75 in 1980/81 and 4.69 in 2025/26. Harvested area grew from 120.1 million hectares to 173.8 million: yield rose 2.56-fold and area 1.45-fold, behind a 3.70-fold rise in rough output, from 220.6 million tonnes to 815.8 million. Most of the extra rice has come from the same fields growing more grain.
1970s to 2010s: China's long lead
China pulled away first. Its share of world milled rice peaked at 39.7% in 1982/83, and the gap with India was widest in 1984/85, when China grew 124.8 million tonnes to India's 58.3 million, 66.4 million more. India kept climbing, with big swings from year to year: its crop fell from 93.3 million tonnes in 2001/02 to 71.8 million in 2002/03. Most of India's rice is still a kharif crop, the season sown at the start of the summer monsoon: 82% of the 2024-25 harvest, by the agriculture ministry's count (our explainer on how monsoons work covers those rains).
China had its own slump. Output reached 140.5 million tonnes in 1997/98, then fell six years running to 112.5 million in 2003/04, before recovering to an all-time high of 149.0 million in 2021/22. It has stayed between 144.6 million and 149.0 million since 2014/15. China now harvests 29.0 million hectares of rice at 7.21 tonnes per hectare, up from 1.90 in 1960/61. The USDA's rough figure for 2025/26 is the one China's National Bureau of Statistics published for its 2025 crop: 209,041,000 tonnes, from 29.0 million hectares sown.
The deltas move up
Below the two giants, the most striking climb belongs to Bangladesh. It grew 37.7 million tonnes in 2025/26, 3.9 times its 1960/61 crop, on only 33% more land (8.86 million hectares then, 11.75 million now): yield went from 1.64 to 4.81 tonnes per hectare. Our guide to the Ganges-Brahmaputra delta covers the landscape behind those numbers. Bangladesh out-produced Indonesia in five of the first eight years, the last in 1967/68, fell behind for half a century, and has been third every year since 2018/19. Part of that swap is Indonesia's own figure, which drops from 37.0 million tonnes in 2017/18 to 34.2 million in 2018/19. Bangladesh's national count is higher than the USDA's: the Bureau of Statistics reported 40.6 million tonnes for 2024-25 against the USDA's 36.6 million, which would widen its lead over Indonesia, not narrow it.
Vietnam went from 6.0 million tonnes in 1960/61 to 26.2 million, 4.4 times as much, with the highest yield of the Southeast Asian countries in the top ten, 6.16 tonnes per hectare; our guide to the Mekong Delta covers the river country of its far south. Its statistics office is quoted at 43.54 million tonnes of unmilled rice for calendar 2025, a little above the USDA's 41.9 million of rough rice. Thailand is the opposite case: 20.7 million tonnes from 11.0 million hectares, a yield of 2.85 tonnes. Only Myanmar is lower in the top ten, at 2.75 tonnes from 6.8 million hectares. The Philippines (12.4 million) sits just above Myanmar (12.0 million), and tenth place moves: Cambodia holds it with 8.1 million tonnes, but Brazil had it the year before, 8.68 million to Cambodia's 8.49 million. Pakistan, 17th in 1960/61, is now 9th with 10.0 million tonnes.
Japan went the other way. Its harvest peaked at 13.2 million tonnes of milled rice in 1967/68, and by 2025/26 it was 7.29 million, 12th in the world, from 1.47 million hectares against 3.31 million in 1960/61. Outside Asia, which grows 89.7% of the world's rice, the largest producers are Brazil (11th, 7.6 million tonnes), the United States (13th, 6.56 million) and Nigeria (14th, 5.90 million). Nigeria grew 239,000 tonnes in 1960/61, and Africa's share of world output has risen from 2.1% to 5.1%.
2024/25 and 2025/26: more land against higher yields
India's rise over the last few years has been fast: 124.4 million tonnes in 2020/21, 154.0 million in 2025/26, 24% more. China went from 148.3 million to 146.3 million over the same years. India harvested 52.8 million hectares of rice in 2025/26, 82% more land than China's 29.0 million, but at 4.37 tonnes per hectare against China's 7.21. India's lead comes from area, not yield.

The USDA's figures for India follow India's own. The agriculture ministry's final estimate for 2024-25 is 150.18 million tonnes of rice, up from 137.83 million in 2023-24, and those are the USDA's numbers for the two years. For 2025-26 the ministry's third advance estimate is 154.02 million tonnes, again matching the USDA, though an advance estimate can still change. So the ranking compares two governments' harvest counts with one conversion between them: China reports grain in the husk, and the USDA mills that at 70%. At India's lower rate of 66.7%, China's crop would come to 139.3 million tonnes, so the conversion narrows India's lead rather than creating it.
| Rank | Country | Milled rice 2025/26 (million t) | Share of world | Rough rice (million t) | Harvested area (million ha) | Yield (t/ha, rough) | Milling rate |
|---|---|---|---|---|---|---|---|
| 1 | India | 154.02 | 28.2% | 231.06 | 52.83 | 4.37 | 66.7% |
| 2 | China | 146.33 | 26.8% | 209.04 | 29.00 | 7.21 | 70.0% |
| 3 | Bangladesh | 37.65 | 6.9% | 56.48 | 11.75 | 4.81 | 66.7% |
| 4 | Indonesia | 33.80 | 6.2% | 53.23 | 11.30 | 4.71 | 63.5% |
| 5 | Vietnam | 26.20 | 4.8% | 41.92 | 6.80 | 6.16 | 62.5% |
| 6 | Thailand | 20.70 | 3.8% | 31.36 | 11.00 | 2.85 | 66.0% |
| 7 | Philippines | 12.35 | 2.3% | 19.60 | 4.74 | 4.14 | 63.0% |
| 8 | Myanmar | 12.00 | 2.2% | 18.75 | 6.83 | 2.75 | 64.0% |
| 9 | Pakistan | 10.00 | 1.8% | 15.00 | 3.76 | 3.99 | 66.7% |
| 10 | Cambodia | 8.10 | 1.5% | 13.28 | 3.78 | 3.51 | 61.0% |
| 11 | Brazil | 7.60 | 1.4% | 11.18 | 1.60 | 6.99 | 68.0% |
| 12 | Japan | 7.29 | 1.3% | 10.27 | 1.47 | 6.98 | 71.0% |
| 13 | United States | 6.56 | 1.2% | 9.38 | 1.11 | 8.45 | 70.0% |
| 14 | Nigeria | 5.90 | 1.1% | 9.37 | 4.50 | 2.08 | 63.0% |
| 15 | Egypt | 4.20 | 0.8% | 6.09 | 0.72 | 8.45 | 69.0% |
Milled or rough: why rice totals differ by a third
Rough rice, also called paddy, is the grain as it leaves the field. The USDA converts each country's rough crop with its own milling rate: 70% for China, 66.7% for India, 66% for Thailand, 63.5% for Indonesia and 62.5% for Vietnam. Summed across every entry, it has 815.8 million tonnes of rough rice for 2025/26 and 545.7 million tonnes milled, 67% of it. So when one source puts world rice output at about 550 million tonnes and another at over 800 million, both can be right. The International Grains Council, counting milled rice over calendar-based years, reached 547.1 million tonnes for 2025/26 in its October 2026 report, within half a percent of the USDA.
The choice of measure also moves the date of the crossover. On rough rice, India edged past China a year earlier, in 2023/24, 206.76 million tonnes to 206.60 million, a margin of 158,000 tonnes that disappears if Taiwan is added to China. The USDA's marketing years also start in different months in different countries, so a 2025/26 figure is not one calendar year's harvest.
The order is not settled. The USDA's current projection for 2026/27 puts both countries at 147.0 million tonnes of milled rice, with India still ahead on rough rice, 220.5 million to 210.0 million. World output is projected to fall to 533.1 million tonnes, and the International Grains Council's forecast also falls, to 535.8 million.
How this was built
Every ranking comes from the USDA Foreign Agricultural Service's PSD Online bulk file of 9 October 2026, commodity "Rice, Milled". It holds 138 entries, 36 of which show no rice production in any year. The file has no world row, so world totals here are the sum of every entry. 2025/26 figures are estimates and 2026/27 a projection. China is the mainland; Taiwan is listed on its own (1.05 million tonnes in 2025/26). The European Union is one entry (1.77 million tonnes), with no rows for member states' crops, so we treat it as a market with no country rank; it still counts toward the world total. On the map, circle area is proportional to tonnes. You can download the data as a CSV: 102 rows, with milled tonnes for every marketing year since 1960/61 and the 2026/27 projection, plus 2025/26 rough tonnes, area, yield and milling rate for each entry.
- USDA Foreign Agricultural Service, PSD Online, grains and pulses bulk file (Rice, Milled): thousand tonnes by marketing year, 1960/61–2026/27, file of 9 October 2026; 2025/26 is an estimate and 2026/27 a projection; US government work, public domain
- National Bureau of Statistics of China, Announcement on 2025 grain output (12 December 2025): 稻谷 (paddy) output and sown area
- India, Department of Agriculture & Farmers Welfare, Final Estimate for 2024-25 (20 November 2025): rice, lakh tonnes, by season
- IndiAgri, report on India's Third Advance Estimates for 2025-26 (28 May 2026)
- International Grains Council, Grain Market Report 581 (15 October 2026): world rice production, milled basis
- The Daily Star, on Bangladesh Bureau of Statistics rice figures (12 November 2025)
- Baconco, quoting Vietnam's General Statistics Office (11 February 2026)
- IRRI, Rice Today: the breeding history of IR8 (15 November 2020): release date and parentage of IR8
- Natural Earth country outlines (via world-atlas): public domain
Commodity tables read the same way sit behind our ranking of the countries that produce the most sugar, where cane and beet tell a very different story about who farms what.