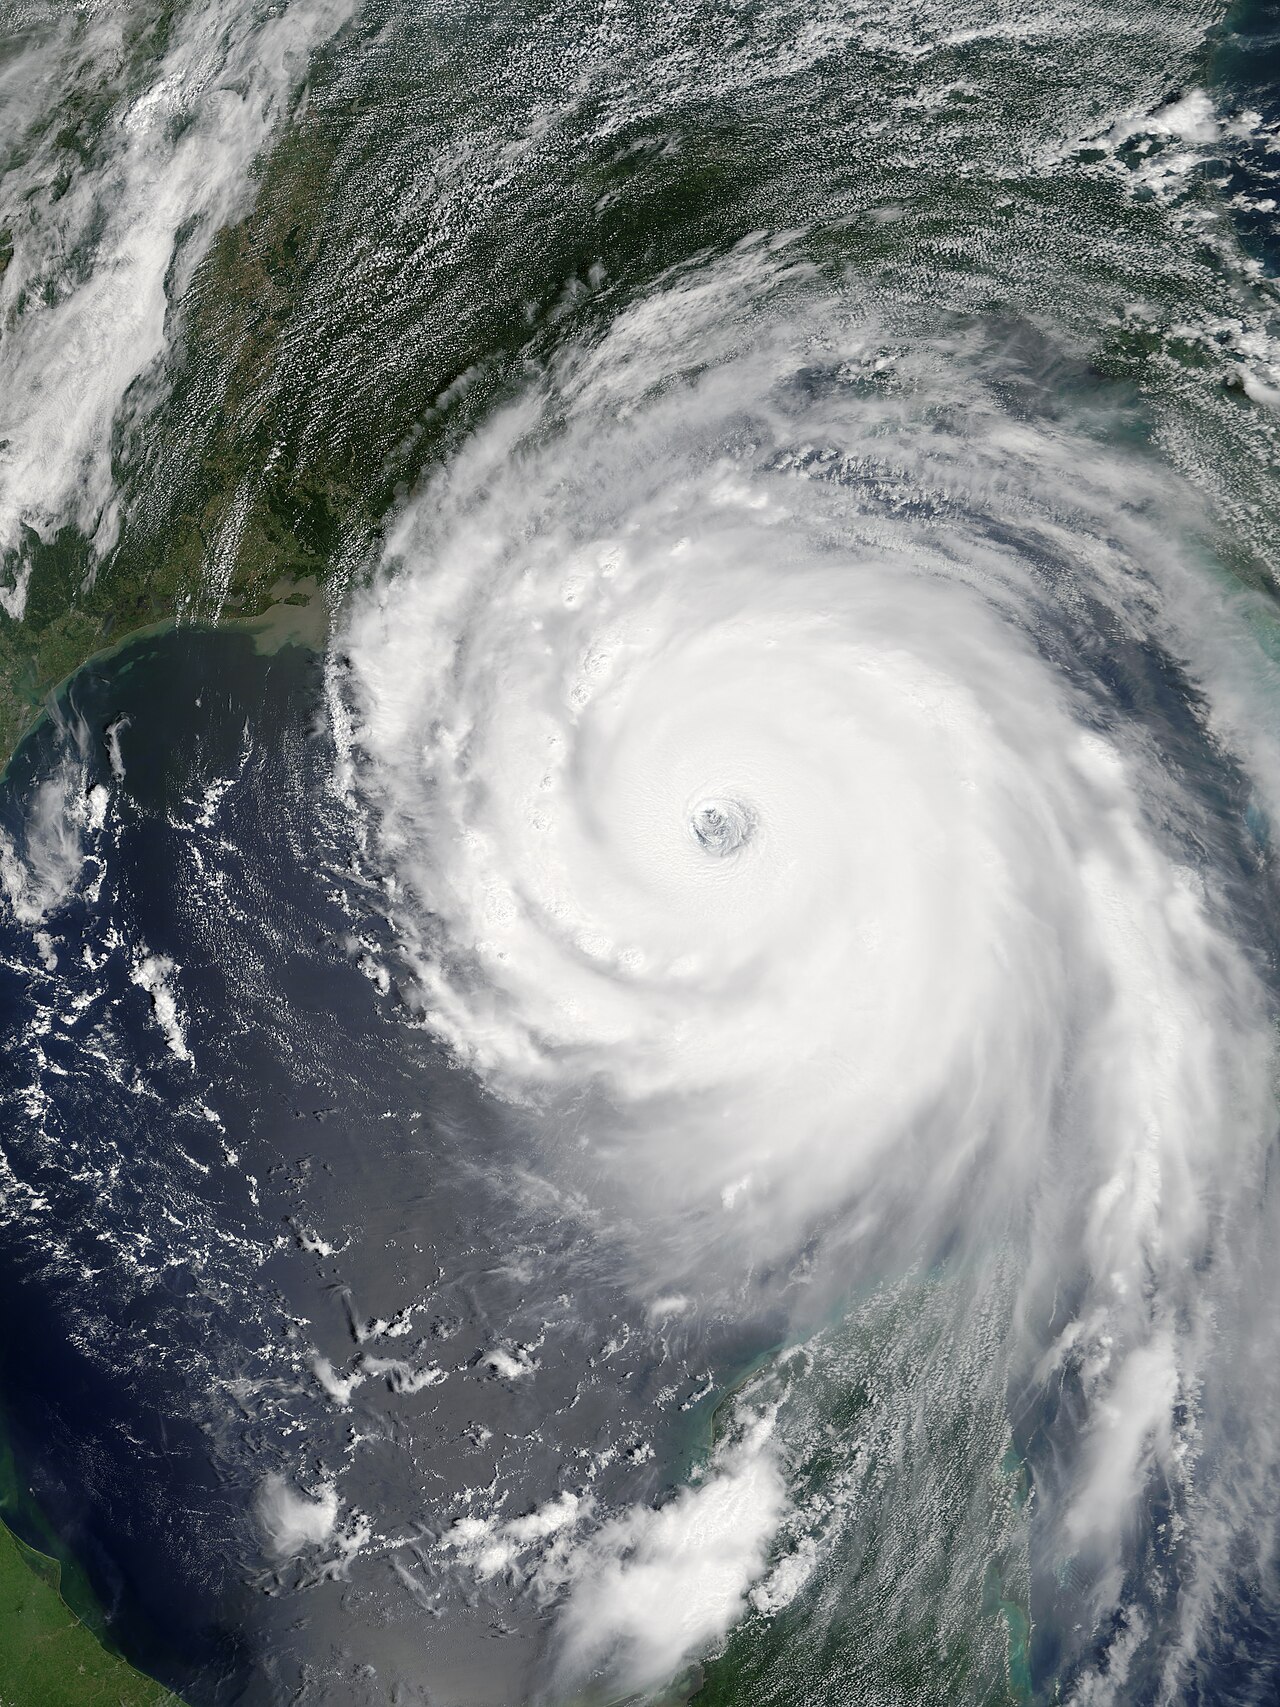
The 2026 Atlantic hurricane season officially runs from June 1 to November 30, with peak activity between mid-August and mid-October. Hurricanes — called typhoons in the Pacific and cyclones in the Indian Ocean — are massive rotating storm systems that form over warm ocean water above 26°C, fueled by the energy of evaporating seawater.
Introduction
An average Atlantic hurricane season produces 14 named storms, 7 hurricanes, and 3 major hurricanes (Category 3+). However, seasons vary enormously: the hyperactive 2020 season produced 30 named storms, while 2022 had just 14. Climate scientists are closely monitoring whether warmer ocean temperatures are making seasons more intense, even as the total number of storms remains debated.
How Hurricanes Form
- Warm Water: Ocean temperature must be at least 26°C (79°F) to a depth of 50+ meters
- Atmospheric Instability: Warm, moist air rising rapidly from the ocean surface
- Coriolis Effect: Earth's rotation causes the storm to spin (counterclockwise in Northern Hemisphere)
- Low Wind Shear: High-altitude winds must be similar to low-altitude winds or the storm gets torn apart
- Distance from Equator: Must form at least 5° from the equator where the Coriolis effect is strong enough
- Tropical Wave: Often begins as a cluster of thunderstorms moving off the west coast of Africa
Hurricane formation begins when a cluster of thunderstorms over warm tropical ocean water organizes into a rotating system. Warm, moist air rises rapidly from the ocean surface, creating an area of low pressure beneath it. As surrounding air rushes in to fill the void, the Coriolis effect (caused by Earth's rotation) deflects the moving air, creating rotation.
As the system strengthens, an "eye" forms at the center — a calm, clear area typically 30-65 km across, surrounded by the "eyewall," where the most intense winds and heaviest rainfall occur. The storm draws its energy from the warm ocean water like a giant heat engine, which is why hurricanes weaken rapidly once they move over land or cooler water.
The Saffir-Simpson Scale
- Category 1: 119-153 km/h — minimal damage to well-built structures
- Category 2: 154-177 km/h — extensive damage to roofs, trees, power infrastructure
- Category 3 (Major): 178-208 km/h — devastating damage; high risk of injury/death
- Category 4: 209-251 km/h — catastrophic damage; areas uninhabitable for weeks-months
- Category 5: 252+ km/h — total destruction of many structures; catastrophic flooding
The Saffir-Simpson Hurricane Wind Scale rates hurricanes from 1 to 5 based on sustained wind speed. However, wind speed alone does not capture the full danger of a hurricane. Storm surge (the wall of ocean water pushed ashore) is often the deadliest hazard and is not directly reflected in the category number. Hurricane Katrina made landfall as "only" a Category 3, but its storm surge reached 8.5 meters, devastating the Gulf Coast.
Major hurricanes (Category 3-5) account for only about 20% of all US landfalls but cause over 80% of total hurricane damage. The destructive power of wind increases exponentially — a Category 5 hurricane's winds carry over 250 times the force of a Category 1.
Hurricane Basins Around the World
- Atlantic: June-November; affects Caribbean, US Gulf/East Coast, Central America
- Eastern Pacific: May-November; affects Mexico's west coast, rarely Hawaii
- Western Pacific: Year-round (peak July-November); world's most active basin; affects Philippines, Japan, China
- North Indian Ocean: April-June and October-December; affects India, Bangladesh, Myanmar
- South Indian Ocean: October-May; affects Madagascar, Mozambique, Australia
- South Pacific: November-April; affects Fiji, Vanuatu, Australia
The Western Pacific is by far the most active tropical cyclone basin, producing an average of 26 tropical storms and 16 typhoons per year. The Philippines is struck by an average of 20 tropical cyclones annually, making it the most typhoon-impacted country on Earth. Super Typhoon Haiyan in 2013 was one of the strongest tropical cyclones ever recorded, with sustained winds of 315 km/h.
The North Indian Ocean produces relatively few cyclones but they are disproportionately deadly because of Bangladesh's extreme vulnerability — the low-lying Ganges Delta coastline, dense population, and limited evacuation infrastructure. The 1970 Bhola cyclone killed an estimated 500,000 people, making it the deadliest tropical cyclone in recorded history.
Deadliest & Costliest Hurricanes
- Deadliest: 1970 Bhola Cyclone (Bangladesh) — ~500,000 deaths
- Costliest: 2017 Hurricane Harvey (USA) — $125 billion in damage
- Strongest Atlantic: 2005 Hurricane Wilma — 882 mb pressure, 295 km/h winds
- Most Destructive US: 2005 Katrina — 1,833 deaths, $125 billion; levee failures in New Orleans
- Recent Notable: 2022 Hurricane Ian — Cat 4, $113 billion, devastating Florida
- Deadliest Atlantic: 1780 Great Hurricane — estimated 22,000+ deaths across the Caribbean
Hurricane Katrina (2005) remains one of the most consequential natural disasters in American history. While the storm itself was powerful, the catastrophe was primarily caused by the failure of poorly designed levees in New Orleans, which allowed 80% of the city to flood. The disaster exposed deep inequities in emergency preparedness and response, particularly affecting low-income and Black communities.
The costliest hurricanes are becoming more expensive not primarily because storms are stronger, but because more people and more valuable property are located in hurricane-prone coastal areas. US coastal counties contain over 127 million people — 40% of the nation's population — and coastal development continues to grow.
Climate Change & Hurricanes
- Warmer Oceans: Higher sea surface temperatures provide more fuel for intensification
- Rapid Intensification: Storms strengthening by 50+ km/h in 24 hours; becoming more common
- Slower Movement: Hurricanes are moving more slowly, dumping more rain on each area
- Higher Storm Surge: Sea level rise of 20+ cm since 1900 amplifies coastal flooding
- More Rainfall: Warmer air holds more moisture — 10-15% more rain per storm
- Debate: Total number of storms may not increase, but intensity of strongest storms likely will
Climate scientists broadly agree that while global warming may not significantly increase the total number of tropical cyclones, it is likely making the strongest storms stronger and wetter. Rapid intensification events — when a storm strengthens by at least 55 km/h in 24 hours — have become significantly more common in the Atlantic basin since the 1980s. Hurricane Otis (2023) intensified from a tropical storm to a Category 5 in just 24 hours before devastating Acapulco.
Sea level rise compounds hurricane damage even without any change in storm intensity. A 30-cm rise in sea level means that storm surges push further inland, flood more area, and take longer to recede. Communities that were marginally safe from flooding in the past are now vulnerable with even modest sea level increases.
Key Facts
- The Atlantic hurricane season runs June 1 to November 30, with peak activity in August-October.
- Hurricanes need ocean water above 26°C (79°F) to form and maintain their strength.
- The Saffir-Simpson Scale rates hurricanes 1-5 based on sustained wind speed.
- The Western Pacific is the world's most active tropical cyclone basin with 26 storms per year average.
- Climate change is making the strongest hurricanes stronger and producing more rainfall per storm.
Fun Facts
- Hurricane names are recycled every six years unless a storm is so deadly or costly that its name is retired. Katrina, Maria, Harvey, and Sandy are all retired names.
- The eye of a hurricane is eerily calm — blue sky is often visible directly above — while just a few km away, the eyewall produces the most violent winds on Earth.
- Jupiter's Great Red Spot is essentially a hurricane that has been raging for over 300 years and is larger than Earth.
- Australian tropical cyclones spin clockwise, opposite to Northern Hemisphere hurricanes, due to the Coriolis effect.
Final Thoughts
Hurricane season is an annual reminder of the power of tropical oceans and atmospheric forces over human geography. As coastal populations grow and climate change potentially intensifies the strongest storms, understanding how hurricanes form, where they strike, and how to prepare has never been more important.
Test Your Knowledge!
Think you know your geography? Try our interactive quiz!
Play Geography Games →