
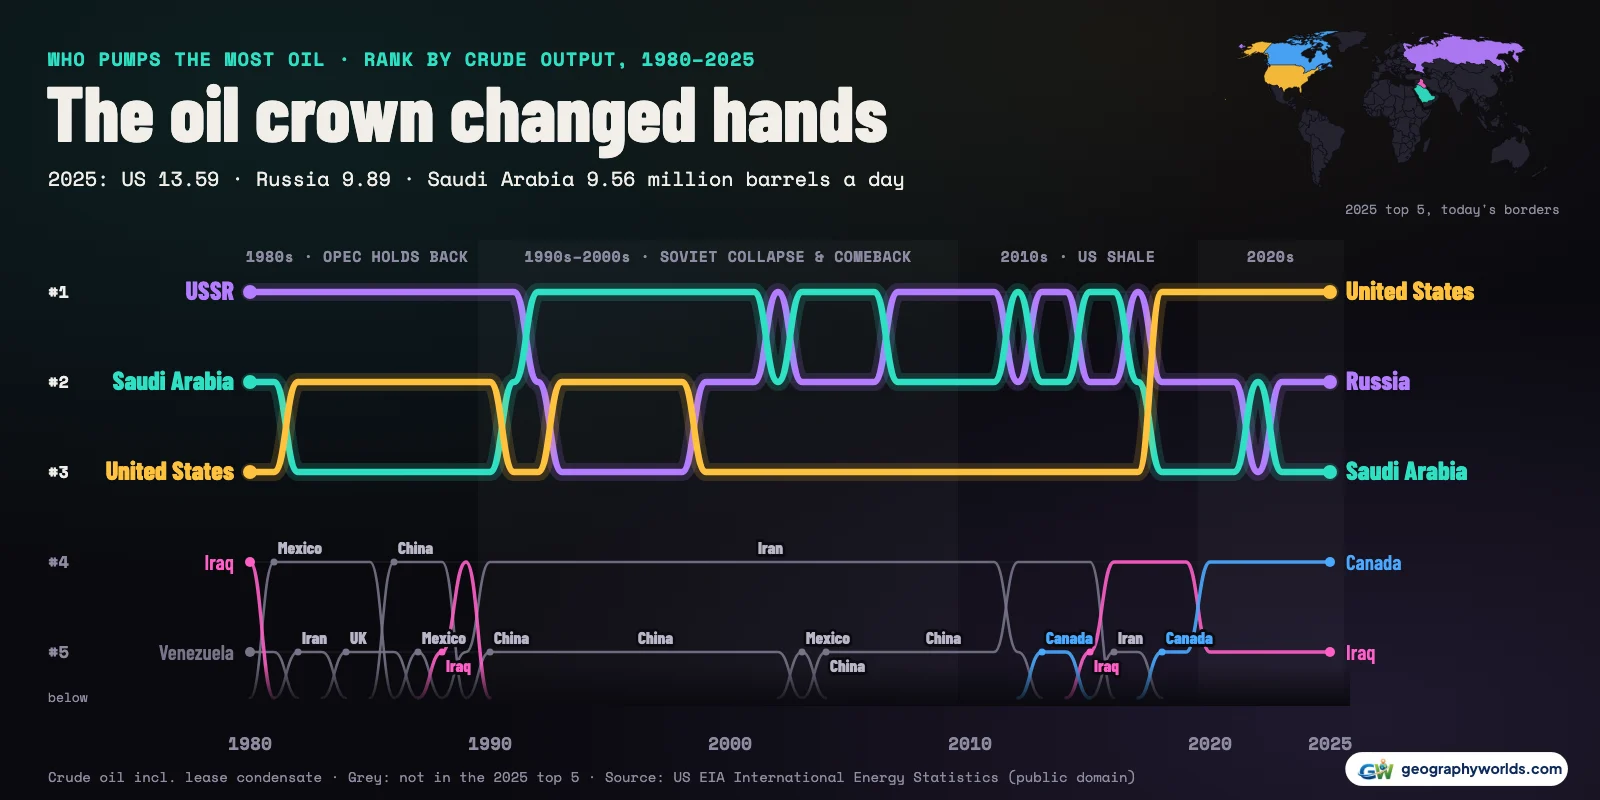
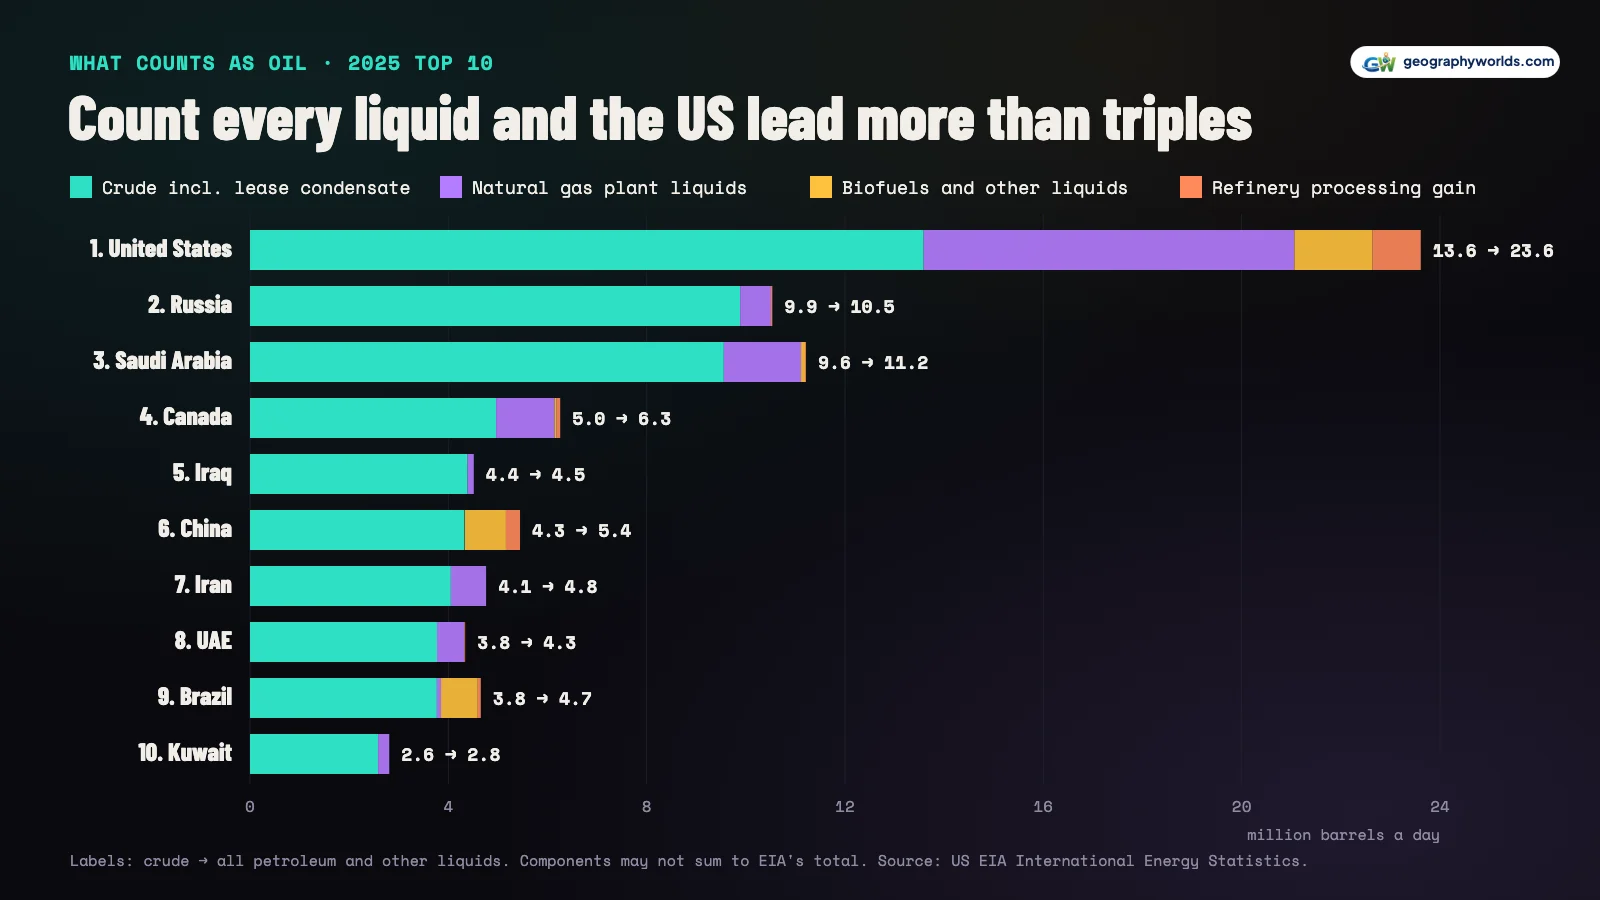
The countries that produce the most oil are the United States (13.59 million barrels a day of crude in 2025), Russia (9.89 million) and Saudi Arabia (9.56 million), followed by Canada (4.96 million), Iraq (4.39), China (4.32), Iran (4.05), UAE (3.77), Brazil (3.77) and Kuwait (2.58). Those are US Energy Information Administration (EIA) annual averages for crude oil including lease condensate, a light liquid produced with gas. Count every petroleum liquid instead, adding natural gas liquids, biofuels and the volume refineries gain in processing, and the US produced 23.61 million barrels a day, more than double Saudi Arabia's 11.21 million, with Russia third on 10.53 million. Either way the US leads by a wide margin. Second place depends on the definition.
The chart at the top ranks every year's producers from 1980 to 2025, on crude, from the EIA's international data. The title passes from the Soviet Union to Saudi Arabia, back and forth between Saudi Arabia and Russia, and finally to the United States. The sections below take it era by era, ending with 2026, when war in the Gulf scrambled the order again.
1980–1989: a Soviet decade while Saudi Arabia held back
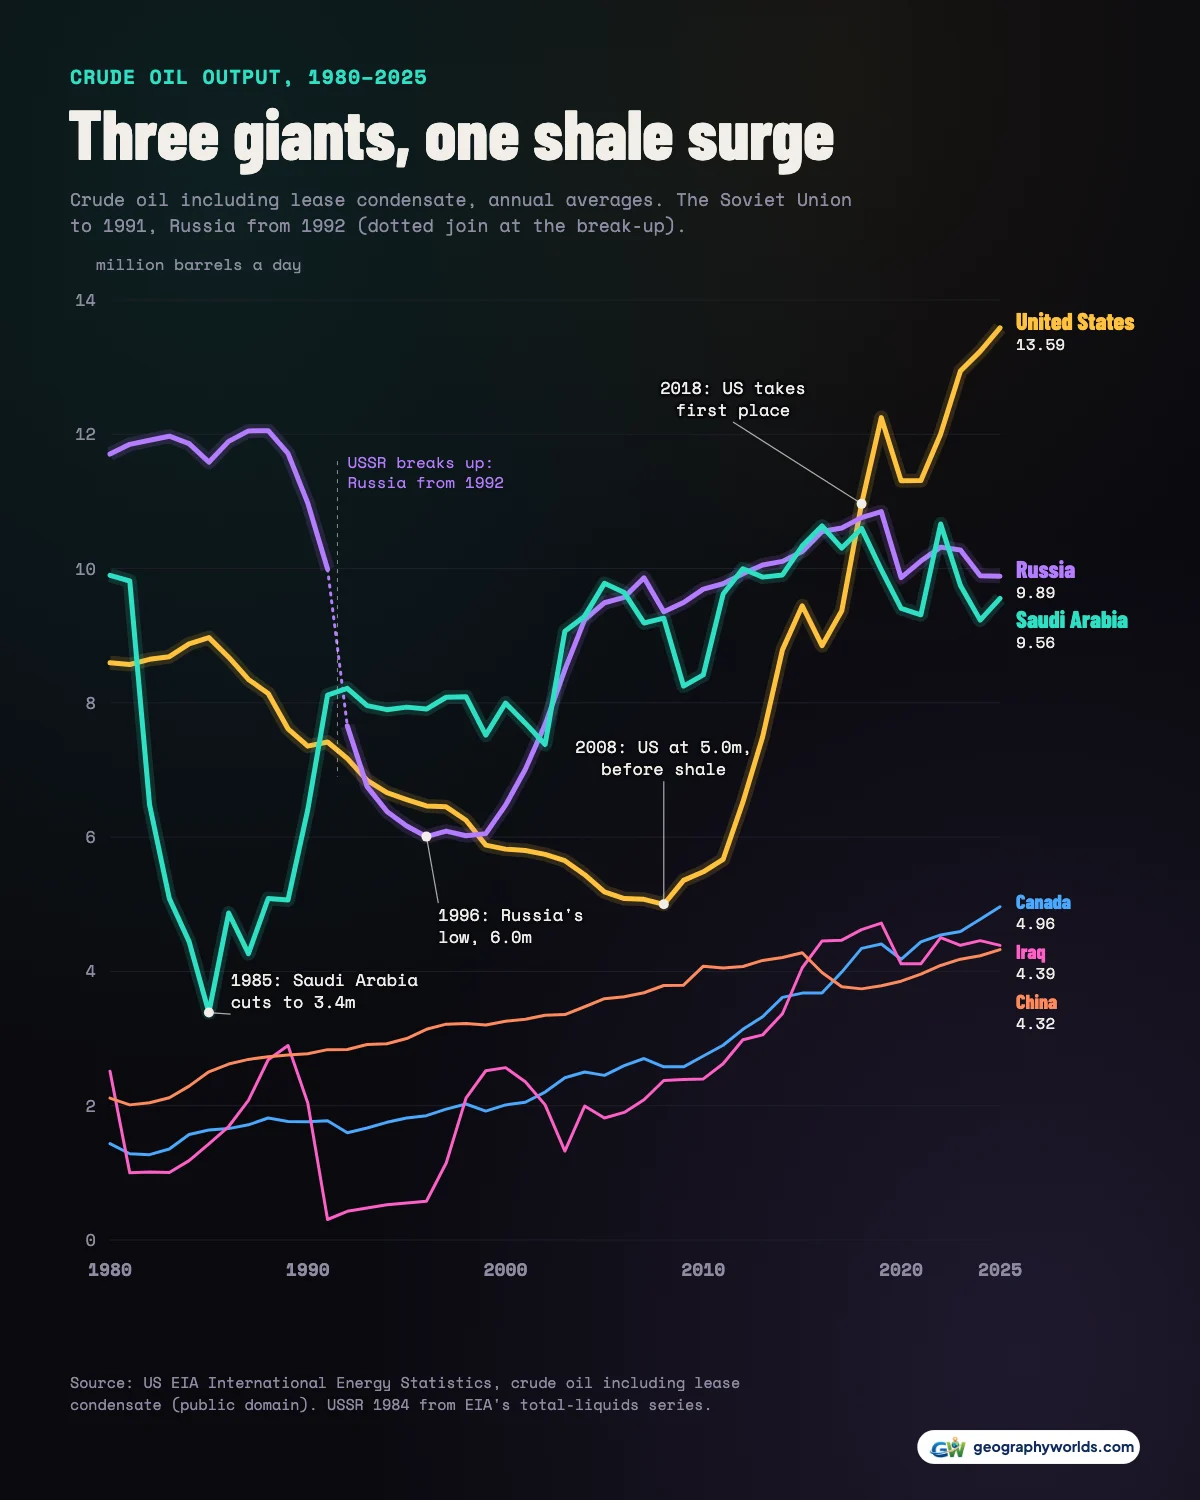
In 1980 the Soviet Union pumped 11.71 million barrels of crude a day, Saudi Arabia 9.90 million and the United States 8.60 million. No other country reached three million. The USSR stayed first in every year of the decade, reaching 12.05 million in 1988.
Saudi Arabia's line on the chart dives. Through the early 1980s the kingdom cut its own output to prop up OPEC's price, and by 1985 it was down to 3.39 million barrels a day, 34% of its 1980 level and only 3rd in the world. That year Mexico was 4th on 2.74 million and the United Kingdom, with its North Sea fields, 5th on 2.53 million. Then Riyadh changed course. A Christian Science Monitor report from February 1986 described the Saudis as fed up with being OPEC's "swing producer" and pumping about two million barrels a day more than the previous autumn, which helped drive prices down. By 1988 Saudi output was back to 5.09 million, still well short of 1980.
The United States was second or third all decade, never first. Its crude output peaked for the decade in 1985 and then slid, the start of a decline that would last more than twenty years.
1990–2009: the Soviet collapse and Russia's comeback
Two shocks hit in quick succession. On 2 August 1990 Iraq invaded Kuwait, and the UN embargo that followed shut Iraqi oil out of the market. Iraq had produced 2.90 million barrels a day in 1989; in 1991 it managed 0.31 million. Kuwait, occupied and looted, fell from 1.78 million to 0.19 million. Saudi Arabia filled much of the gap, raising output by 3.05 million barrels a day between 1989 and 1991, to 8.12 million.
The second shock was slower and bigger. Soviet output was already sliding, to 9.99 million barrels a day in 1991, when Mikhail Gorbachev resigned on 25 December 1991 and the union dissolved. Russia produced 7.66 million in 1992, its first year as an independent state, and kept falling to 6.01 million in 1996. With the Soviet giant split up and shrinking, Saudi Arabia was the world's biggest crude producer every year from 1992, at 8.22 million, to 2001.
Russia's recovery was just as steep. Output rose every year from 1999 to 2007, and in 2002 Russia's 7.68 million barrels a day edged past Saudi Arabia's 7.38 million for the first time. For the next decade and a half the two traded the lead almost year by year: Russia was first in 2002, 2007–2011, 2013–2014, 2017, Saudi Arabia in the years between.
Meanwhile the United States kept sinking. Its crude production reached a low of 5.00 million barrels a day in 2008, 58% of the 1980 level, and in crude terms it was a distant third.
2010–2019: shale lifts the United States to the top
What happened next is the steepest line on either chart. US crude output went from 5.48 million barrels a day in 2010 to 12.25 million in 2019, a gain of 6.76 million a day in nine years, more than Iraq or China produced in 2025. Tight oil drove it: crude released by horizontal drilling and fracturing of shale and other dense rock. OPEC's March 2026 Monthly Oil Market Report puts US tight crude at 9.09 million barrels a day in 2025, about two-thirds of the country's crude, much of it from the Permian Basin of Texas and New Mexico.

In 2018 the United States became the world's largest crude producer, with 10.96 million barrels a day against Russia's 10.76 million and Saudi Arabia's 10.60 million. It has been first every year since. It had never led on crude before in this 1980–2025 series.
On EIA's broader measure, which adds natural gas liquids, biofuels and refinery gain, the date is different, and so is the story. The US already led on that basis in 1993–1999, 2001–2002, 2013–2025, because it produces far more natural gas liquids than anyone else: 7.48 million barrels a day in 2025, against Saudi Arabia's 1.56 million. Shale made the gap decisive: in 2012 Saudi Arabia was still ahead, 11.49 million to 11.14 million, and in 2013 the US moved in front with 12.40 million to Saudi Arabia's 11.27 million. The Energy Institute's Statistical Review, compiled independently of EIA, has the US first from 2017 on its crude-plus-gas-liquids measure, as Our World in Data presents it in energy terms.
2020–2026: a record year, then war in the Gulf
US crude output fell by 0.94 million barrels a day in 2020, to 11.31 million, recovered past its 2019 peak in 2023 and set a new record each year since, reaching 13.59 million in 2025, its highest annual figure in the EIA series. That is 16% of the world's 84.4 million barrels a day of crude. The top three together produced 39% of it, and the top ten 72%.
| Rank | Country | Crude incl. condensate, 2025 (million b/d) | Share of world crude | All petroleum liquids, 2025 (million b/d) | Rank on all liquids | Crude rank in 2000 |
|---|---|---|---|---|---|---|
| 1 | United States | 13.59 | 16.1% | 23.61 | 1 | 3 |
| 2 | Russia | 9.89 | 11.7% | 10.53 | 3 | 2 |
| 3 | Saudi Arabia | 9.56 | 11.3% | 11.21 | 2 | 1 |
| 4 | Canada | 4.96 | 5.9% | 6.26 | 4 | 13 |
| 5 | Iraq | 4.39 | 5.2% | 4.50 | 8 | 9 |
| 6 | China | 4.32 | 5.1% | 5.45 | 5 | 5 |
| 7 | Iran | 4.05 | 4.8% | 4.77 | 6 | 4 |
| 8 | UAE | 3.77 | 4.5% | 4.34 | 9 | 11 |
| 9 | Brazil | 3.77 | 4.5% | 4.66 | 7 | 17 |
| 10 | Kuwait | 2.58 | 3.1% | 2.80 | 10 | 14 |
| 11 | Kazakhstan | 2.05 | 2.4% | 2.15 | 11 | 23 |
| 12 | Norway | 1.86 | 2.2% | 2.05 | 12 | 6 |
| 13 | Mexico | 1.73 | 2.0% | 1.87 | 14 | 7 |
| 14 | Nigeria | 1.61 | 1.9% | 1.68 | 15 | 12 |
| 15 | Libya | 1.36 | 1.6% | 1.38 | 17 | 15 |
Further down, the 2020s belong to the Americas. Canada rose from 2.01 million barrels a day of crude in 2000 to 4.96 million in 2025, fourth in the world. The Canada Energy Regulator puts 2025 at a record 5.35 million barrels a day of "crude oil and equivalents", a measure that sits between EIA's two. Brazil went from 2.44 million in 2015 to 3.77 million, level with the UAE; Brazil's regulator, the ANP, reports 3.770 million, an all-time high, mostly from deep offshore pre-salt fields. Guyana, which had no oil output to speak of in 2019, reached 0.75 million in 2025, 22nd in the world. Kazakhstan, on 2.05 million, is 11th, just outside the top ten.
Then 2026 broke the pattern. EIA's monthly figures show world crude output falling by 10.4 million barrels a day between February and March 2026. The International Energy Agency's April Oil Market Report called it "the most severe oil supply shock in history", caused by the Iran war and restrictions on tankers passing through the Strait of Hormuz. In EIA's monthly figures, Saudi crude went from 10.76 million barrels a day in February to 7.50 million in March and 6.64 million in May 2026. Iraq fell from 4.46 million to 1.32 million, and Kuwait from 2.66 million to 0.54 million. Taken together, six Gulf producers (Saudi Arabia, Iraq, Iran, the UAE, Kuwait and Qatar) went from 27.2 million barrels a day to 14.4 million.
In May 2026 the US produced 13.71 million barrels a day and Russia 9.72 million, now clearly second, with Saudi Arabia third. Canada was 4th and Brazil 6th. In September the IEA still counted more than 10 million barrels a day of Gulf output shut in and did not expect a full recovery in Middle East supply before 2027. The ranking for 2026 as a whole will look very different from 2025's.
Why the second place depends on who is counting
"Oil" has no single definition, and the ranking below first place depends on it. We rank crude including lease condensate, the closest match to oil coming out of the ground. On that measure Russia, at 9.89 million barrels a day in 2025, edges out Saudi Arabia at 9.56 million.
OPEC's own tables leave condensate out. Its March 2026 report, based on secondary sources, puts Saudi crude at 9.471 million barrels a day for 2025 and Russia's at 9.129 million, so on OPEC's definition Saudi Arabia is second. Saudi Arabia's own figure, reported directly to OPEC, is 9.480 million, close to EIA's. Russia's government reports its output in tonnes and includes condensate: Deputy Prime Minister Alexander Novak put 2025 at 512 million tonnes, down 0.77% on 2024, according to Interfax. The main reason for the gap is condensate, which EIA counts as crude and OPEC's crude tables leave out.
Widen the definition to every petroleum liquid and Saudi Arabia is second again, on 11.21 million to Russia's 10.53 million, because it produces 1.56 million barrels a day of gas liquids. The US lead over second place grows from 3.70 million barrels a day on crude to 12.40 million on all liquids. That broad total came to 106.2 million barrels a day worldwide in 2025, against 84.4 million of crude. It is close to the IEA's view: its September report expects 100.7 million in 2026 after a fall of 5.7 million, which puts 2025 at about 106.4 million.
All figures here are EIA annual averages in barrels per day. The Soviet Union is counted until 1991 and Russia from 1992; EIA has no 1984 crude figure for the USSR, so we used its total-liquids figure, which matches the crude series in every other Soviet year. You can download the data as a CSV with every producer's 2025 crude and all-liquids output, its share of world crude and its rank every five years since 1980. Parity will turn that file into a bump chart or a line chart of your own in a few clicks.
Sources:
- US Energy Information Administration, International Energy Statistics (bulk file INTL.zip): Annual and monthly production in thousand barrels per day; file updated 30 Sep 2026. US government work, public domain (EIA copyright and reuse page).
- OPEC Monthly Oil Market Report, March 2026: Cross-check: 2025 crude production by secondary sources and by direct communication.
- IEA Oil Market Reports, April and September 2026: Context for the 2026 supply shock.
- Natural Earth country boundaries via world-atlas (1:110m): Public domain. Used for the locator map only.
Production is only half of the picture: the biggest producers are not always the countries sitting on the most oil, as the ranking of countries with the most oil reserves shows, and several of the names above are members of the group listed in our guide to OPEC countries.