
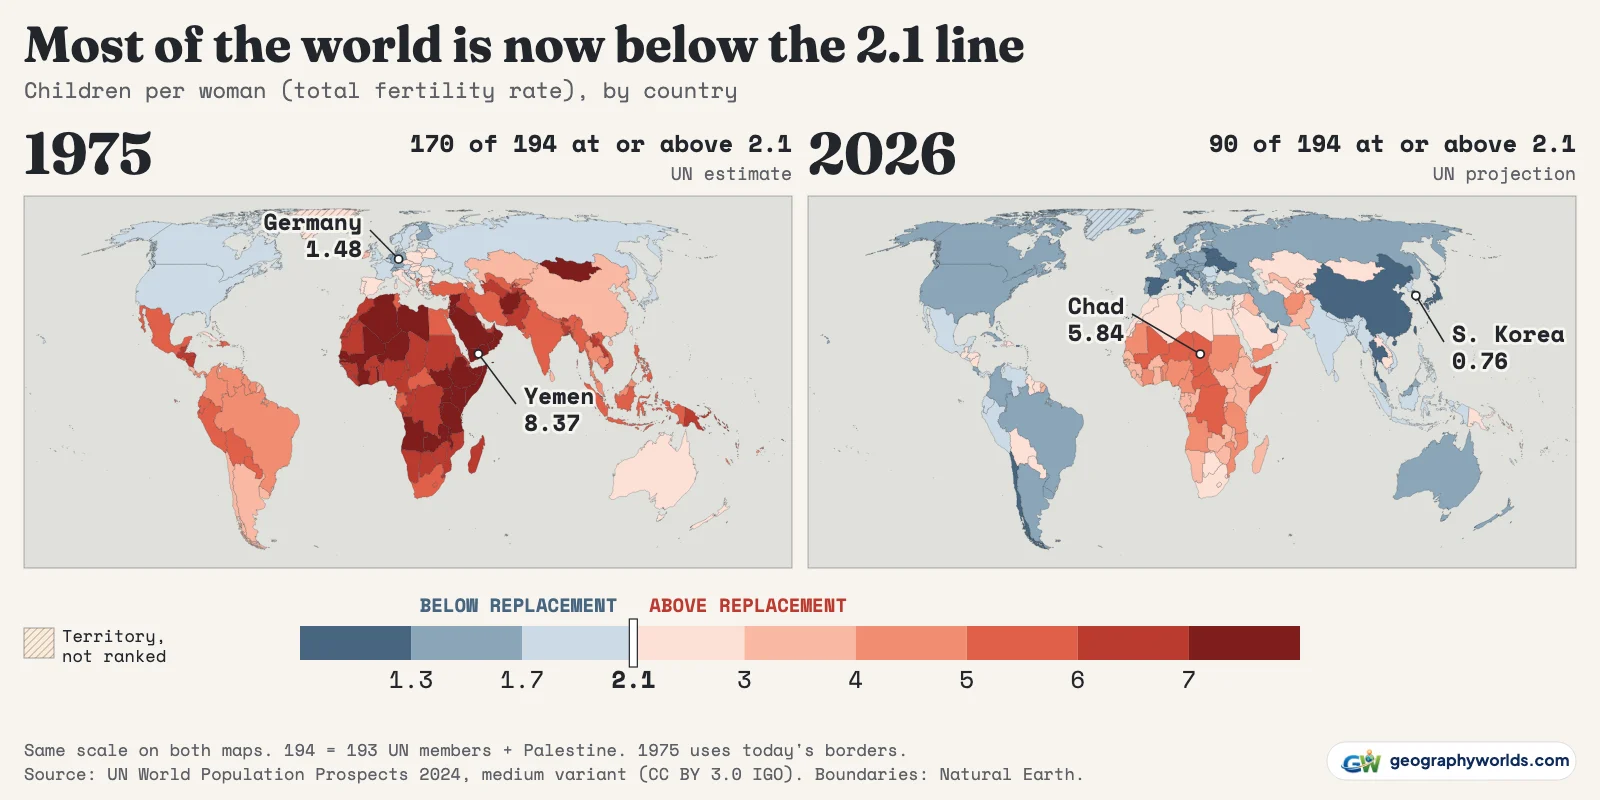
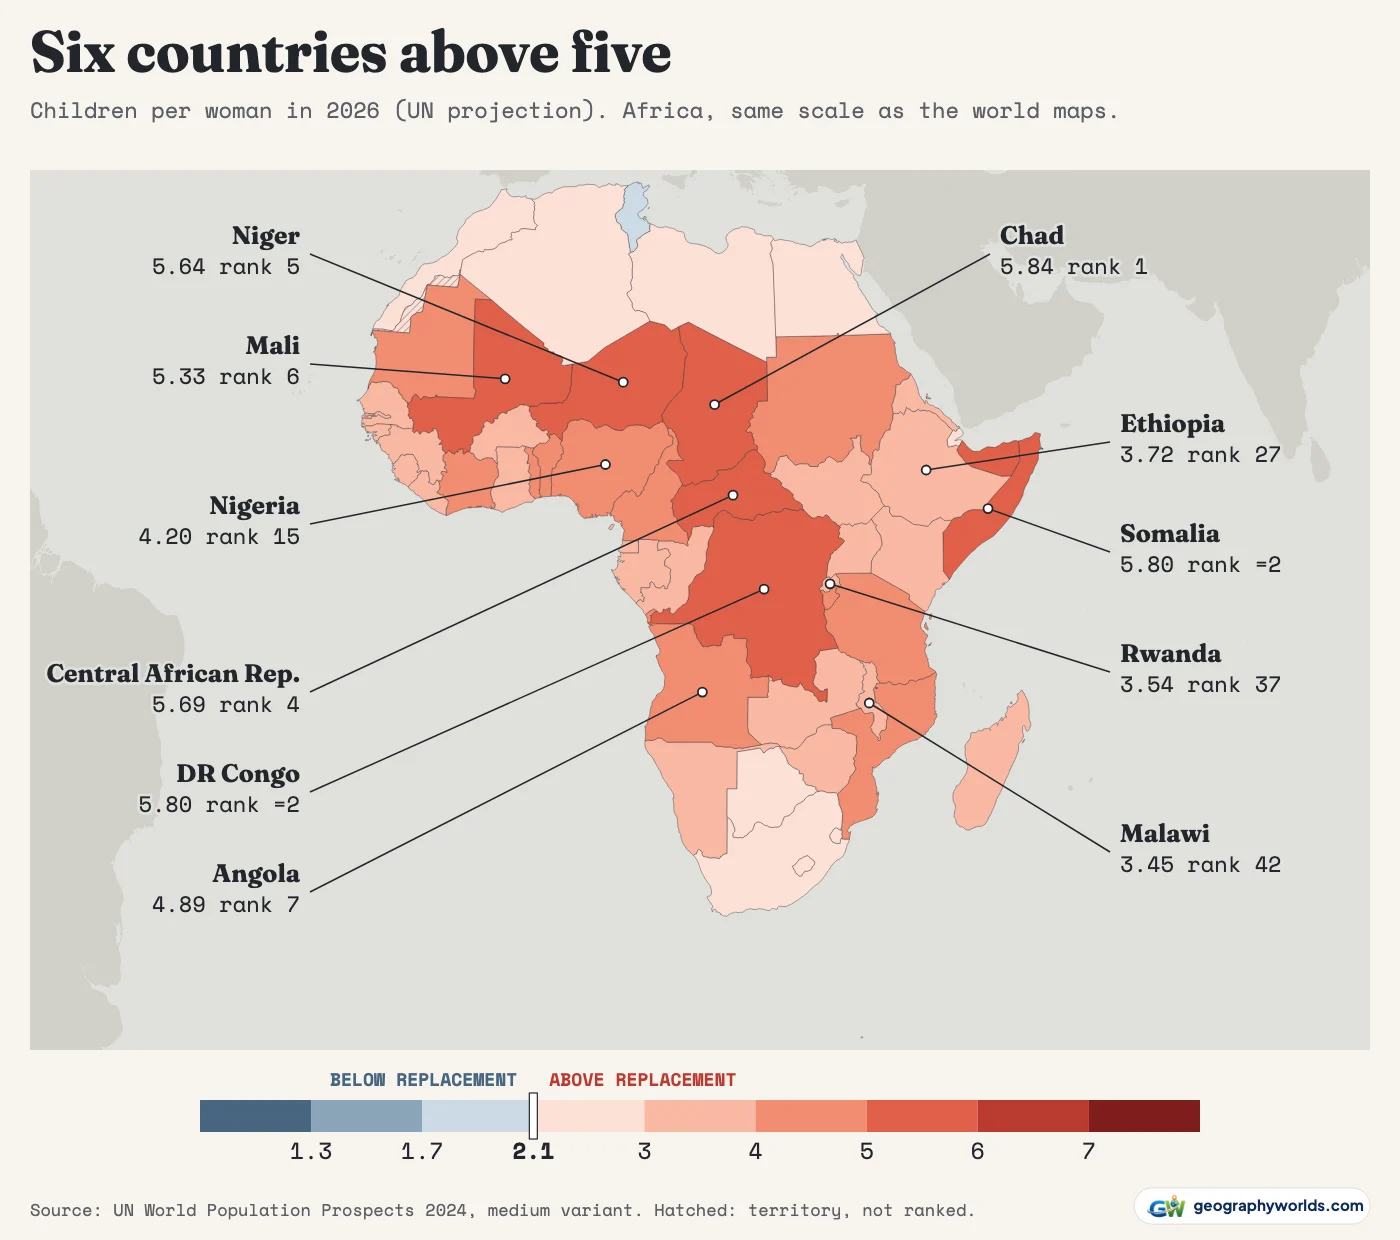
The countries with the highest fertility rates are Chad (5.84 children per woman), Somalia and DR Congo (both 5.80), the Central African Republic (5.69), Niger (5.64) and Mali (5.33), on the United Nations' medium-variant projections for 2026. They are the only six of 194 countries at five or more. The total fertility rate is the number of children a woman would have if she lived through her childbearing years at this year's birth rates for each age. The lowest of the 194 is South Korea's, 0.76, and the world figure is 2.23, down from 4.08 in 1975.
The number to watch is 2.1, which the UN calls the replacement level: roughly the rate, in a population with low mortality, at which each generation is followed by one of the same size. In 1975, 170 of today's 194 countries were at or above it. In 2026 the count is 90. By population, the share of humanity living in places at or above 2.1 has gone from 80% to 27%.
These figures come from World Population Prospects 2024, still the newest edition, because the UN has postponed the next one from 2026 to 2027. Its estimates stop at 2023, so every 2026 value here is a projection. In 2023, the last estimated year, Somalia (6.13) sat just ahead of Chad (6.12) and Niger (6.06). The 1975 values are reconstructed for today's borders.
Six countries above five, from Mali to the Indian Ocean
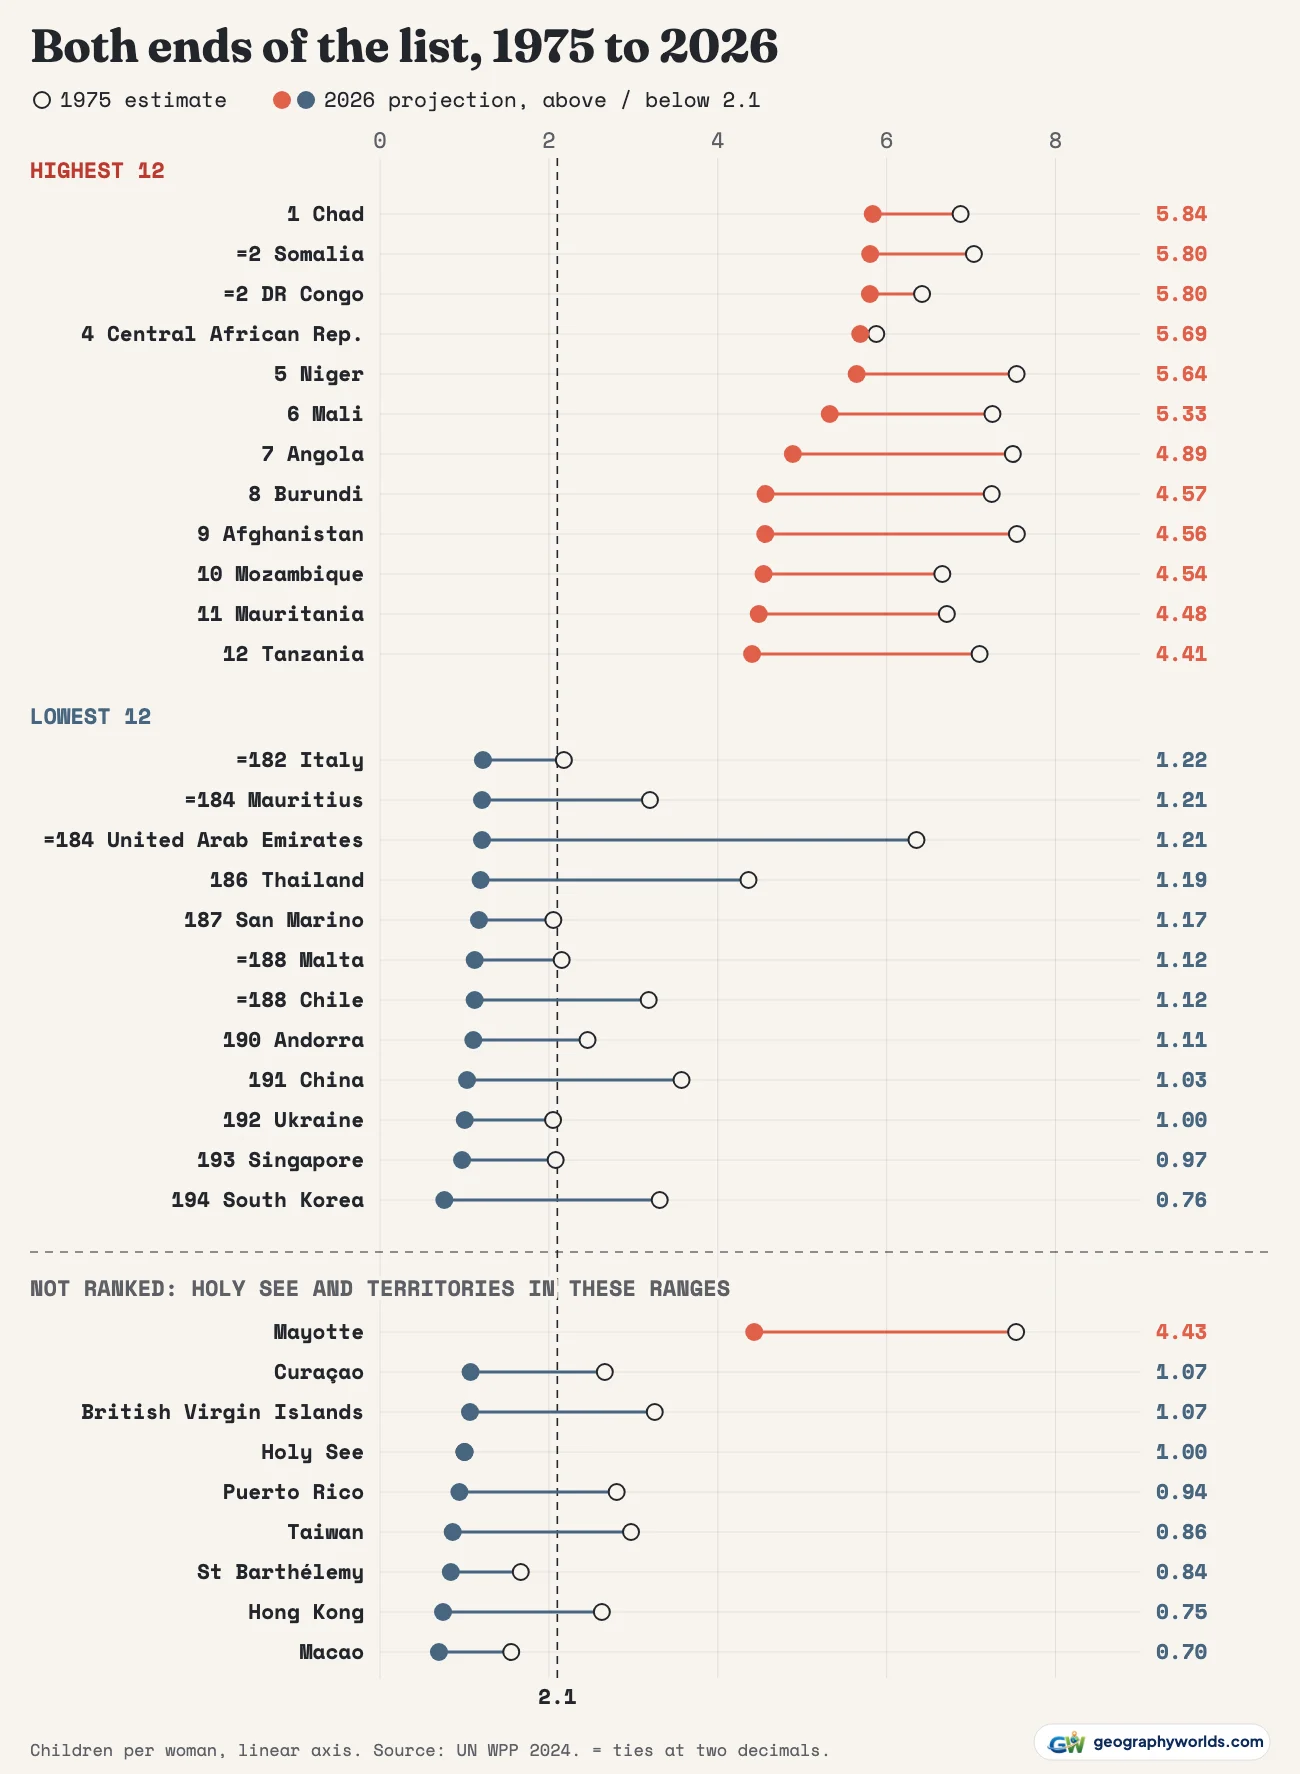
The ranking covers the 193 UN members and Palestine, an observer state, on a single rule: the 2026 value to two decimals, with equal figures shown as ties. The other observer, the Holy See, is left out: its flat 1.00 in every estimate year is a placeholder for a tiny, mostly celibate population. It and 42 territories and non-members are in the CSV, unranked and hatched on the maps. Mayotte, a French department, is the one that would change the top of the table: at 4.43 it would come 12th. Afghanistan, 9th at 4.56, is the first country outside Africa.
| Rank | Country | 1975 (estimate) | 2023 (last estimate) | 2026 (projection) | Change 1975–2026 |
|---|---|---|---|---|---|
| 1 | Chad | 6.88 | 6.12 | 5.84 | −1.04 |
| =2 | Somalia | 7.03 | 6.13 | 5.80 | −1.23 |
| =2 | DR Congo | 6.42 | 6.05 | 5.80 | −0.62 |
| 4 | Central African Republic | 5.88 | 6.01 | 5.69 | −0.19 |
| 5 | Niger | 7.54 | 6.06 | 5.64 | −1.89 |
| 6 | Mali | 7.25 | 5.61 | 5.33 | −1.93 |
| 7 | Angola | 7.49 | 5.12 | 4.89 | −2.61 |
| 8 | Burundi | 7.24 | 4.88 | 4.57 | −2.68 |
| 9 | Afghanistan | 7.54 | 4.84 | 4.56 | −2.98 |
| 10 | Mozambique | 6.66 | 4.76 | 4.54 | −2.12 |
| 11 | Mauritania | 6.71 | 4.70 | 4.48 | −2.23 |
| 12 | Tanzania | 7.10 | 4.61 | 4.41 | −2.69 |
| 13 | Benin | 6.83 | 4.56 | 4.34 | −2.49 |
| 14 | Yemen | 8.37 | 4.59 | 4.33 | −4.05 |
| 15 | Nigeria | 6.77 | 4.48 | 4.20 | −2.57 |
On UN figures, no country reaches six in 2026. In 1975, 72 did. Yemen led that year at 8.37 and is now 14th at 4.33. The UN's series hands the top spot from Rwanda to Yemen, then to Niger from 1995 to 2018, Somalia, and finally Chad, which leads only in the projected years, from 2024, because the model has rates elsewhere falling faster.
First place depends on whose figures you trust
Do not read much into the order of the top five. The CIA World Factbook's last edition, with estimates for 2024, puts Niger first at 6.64 and Chad sixth at 5.24, and has the Central African Republic at just 3.94 against the UN's 5.69. Household surveys in the DHS Program data disagree with both in places: Mali's 2023-24 survey found 6.0 against the UN's 5.61 for 2023, and DR Congo's found 5.5 against 6.05. Chad's latest survey in that data is from 2014-15, and Somalia's own 2020 survey found 6.9, above every UN figure here. Treat the leaders as a cluster.
| Country | UN 2026 | UN rank | Factbook 2024 | Factbook rank | Latest survey in DHS data |
|---|---|---|---|---|---|
| Chad | 5.84 | 1 | 5.24 | 6 | 6.4 (2014-15) |
| Somalia | 5.80 | =2 | 5.12 | 8 | 6.9 (SHDS 2020) |
| DR Congo | 5.80 | =2 | 5.49 | 3 | 5.5 (2023-24) |
| Central African Republic | 5.69 | 4 | 3.94 | 25 | none in DHS |
| Niger | 5.64 | 5 | 6.64 | 1 | 6.2 (2021) |
| Mali | 5.33 | 6 | 5.35 | 4 | 6.0 (2023-24) |
| Angola | 4.89 | 7 | 5.70 | 2 | 4.8 (2023-24) |
In the Sahel, big families are largely what people say they want
The UN describes two forces behind falling fertility: as more children survive and raising them costs more, large families stop paying; and new ideas about family size spread, along with contraception. The Sahel shows what it looks like when neither has gone far.
When DHS surveys ask women their ideal number of children, the mean answer was 9.2 in Niger (2012) and 8.2 in Chad (2014-15). In Mali it was 6.4 in 2023-24, up from 5.9 in 2012-13. Modern contraception is rare but moving: 5.0% of married women in Chad used it in 2014-15 and 12.2% in Niger in 2012, while Mali went from 9.9% to 20.9% between those two surveys.
World Bank analysts pointed out in 2016 that the gap between wanted and actual fertility in Niger and Chad was only about 3% in surveys from 2003-14, so supply alone is not the story. They list children as future earners and old-age support where pensions are absent, the prestige of a large family, insurance against child deaths, men's preferences and religious and cultural objections to limiting births.

A study of Burkina Faso, Chad, Mali and Niger found that women were moving on to further births at much the same rates over four decades, but later, with the age at a seventh child rising. Niger's own surveys now show a fall, from 7.6 in 2012 to 6.2 in 2021.
Northern Nigeria belongs to the same belt
Nigeria's 2023-24 survey found 4.8 nationally (the UN has 4.48 for 2023), but 6.1 in the North East and 5.9 in the North West against 4.1 in the South East, 3.4 in the South West and 3.3 in the South South. Yobe state reached 7.5, higher than any national rate on the UN's list. The national ideal family size is 5.6, and 15.3% of married women use a modern method.
East Africa, where contraception moved the number
Rwanda was second in the world in 1975 at 8.10 and is projected at 3.54 now. The Population Reference Bureau calls its 25% fall between 2005 and 2010 one of the fastest in DHS history. Modern contraceptive use among married women went from about one in ten in 2005 to 45.1% in 2010 and 64.2% in 2025. PRB credits a 2008 national strategy with fertility targets, decentralised care, family planning folded into every health service and clinic funding tied to client numbers, along with schooling gains.
Malawi tells a similar story: 66.4% modern use, a survey rate of 3.7 and an ideal family size of 3.7 in 2024. Ethiopia is the warning against assuming a straight line. Its rate is down to 4.0 in the 2024-25 survey, but modern use slipped from 40.5% in 2019 to 34.5%, and the ideal family rose from 4.3 in 2011 to 5.1 in 2024-25.
Iran and Bangladesh showed how fast it can happen
Asia holds most of the fastest falls on record: eight of the ten below. The largest drop of any country since 1975 is the Maldives, from 7.32 to 1.53. The fastest crossing is Iran's. Measured from the last year at five or more to the first below 2.1, it took ten years, 1989 to 1999, against 12 for Singapore.
PRB ties that fall to a programme revived in late 1989, delivered through a primary health network that reached every region and income level, with the religious leadership in support and rural development and literacy programmes behind it. Couples delayed first births, spaced later ones and stopped sooner.
Bangladesh did it while poor. From 6.73 in 1975 it is projected to dip just below the line at 2.09 in 2026, though its 2022 survey still found 2.3. The World Bank's account credits the 1977 Matlab experiment with home visits, married female outreach workers going door to door, and imams trained to explain that Islam does not forbid family planning. India's average, 2.0 in its 2019-21 survey, spans 3.0 in Bihar to 1.1 in Sikkim.
Latin America's later drop runs through teenagers
South America has gone from 4.36 to 1.68 since 1975; Colombia from 4.40 to 1.60, Mexico from 5.74 to 1.85. The UN says rapid falls in early childbearing have pulled total rates down, with adolescent birth rates in Chile, Costa Rica and Puerto Rico dropping by more than two thirds in three decades. Chile is now at 1.12, among the lowest on Earth. Colombia, Mexico, Nicaragua and Venezuela still had more than 50 births per 1,000 women aged 15 to 19 in 2024, and the UN says a steep fall in places like Mexico could push total rates lower still.
The bottom of the list is East Asia, and it has company
| Rank | Country | 1975 (estimate) | 2023 (last estimate) | 2026 (projection) |
|---|---|---|---|---|
| 194 | South Korea | 3.31 | 0.72 | 0.76 |
| 193 | Singapore | 2.08 | 0.94 | 0.97 |
| 192 | Ukraine | 2.05 | 0.98 | 1.00 |
| 191 | China | 3.57 | 1.00 | 1.03 |
| 190 | Andorra | 2.46 | 1.08 | 1.11 |
| =188 | Chile | 3.18 | 1.17 | 1.12 |
| =188 | Malta | 2.15 | 1.10 | 1.12 |
| 187 | San Marino | 2.05 | 1.15 | 1.17 |
South Korea's official rate was 0.72 in 2023, 0.75 in 2024 and a preliminary 0.80 in 2025, so reality has already passed the UN's 0.76 projection. An OECD working paper points to the difficulty of combining careers and motherhood, visible in wide gender gaps in pay and work, with private education and housing costs on top. China (1.03) had a brief rise after the one-child policy was repealed, then a quick, deep decline.
Three unranked places belong in this company: Macao (0.70), Hong Kong (0.75) and Taiwan (0.86). In the EU, Eurostat records 1.34 for 2024, with mothers averaging 29.9 at a first birth. Its figure for Malta, 1.01, is well below the UN's projected 1.12, a reminder that projections at this end can run behind events.
Two places that went against the curve
Kazakhstan fell after the Soviet collapse and then climbed: the UN has a low of 1.90 in 2000 and a high of 3.32 in 2021. A 2023 study, with 1.80 in 1999 and 3.00 in 2018, found the rise across birth orders, both main ethnic groups and education levels, with oil-led growth as background and family benefits and re-traditionalisation only tentative explanations. Israel, at 2.73, is far ahead of the rest of the OECD: the next member, Mexico, is at 1.85. The Taub Center, using 2015 data, found pronatalist norms across every education level, with even secular and traditional Jewish women above 2.2.
Where the line goes next
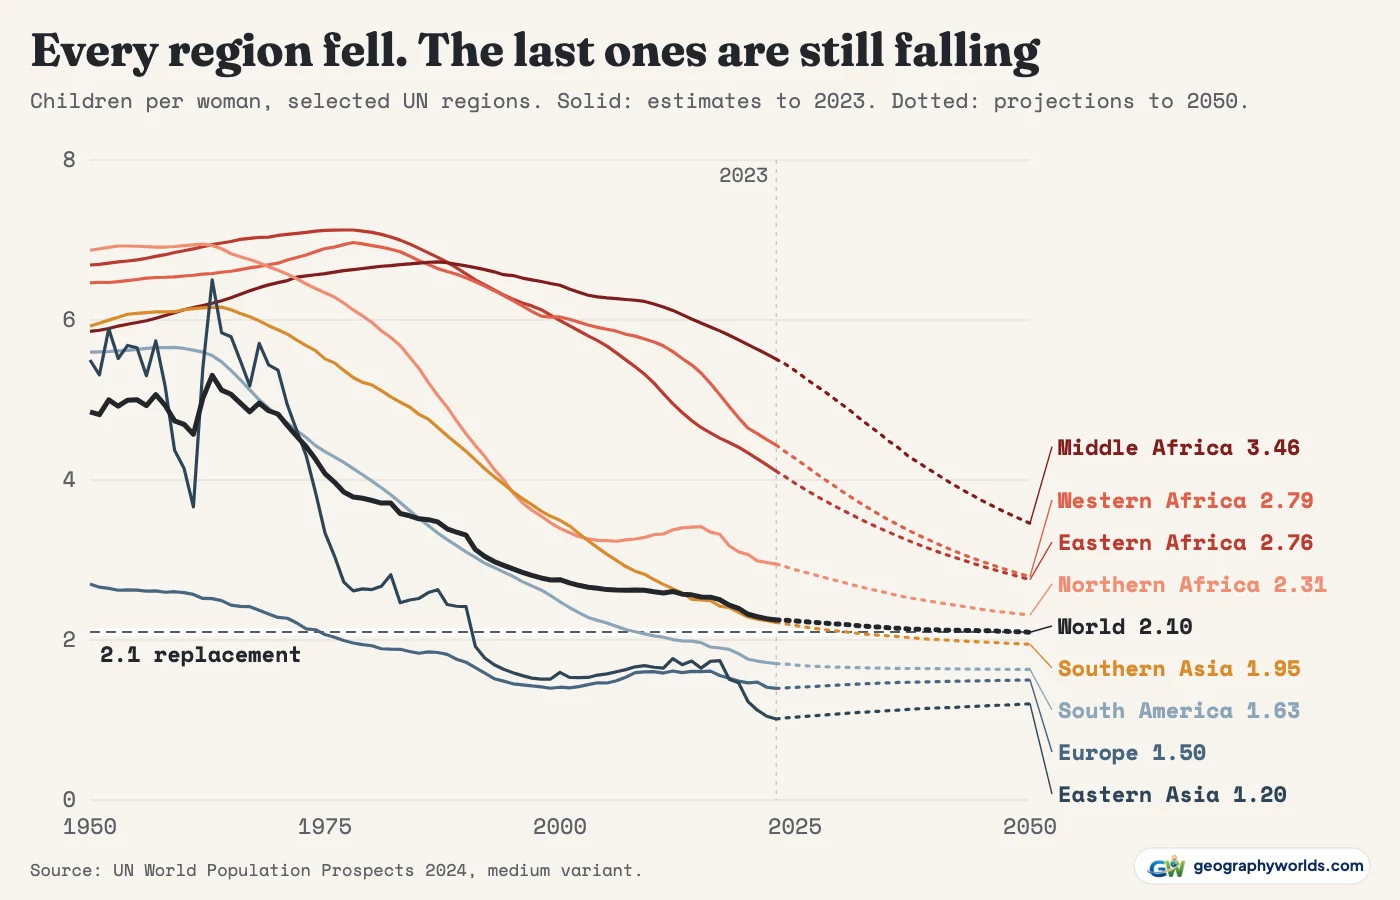
The UN's medium variant has the world reaching 2.1 around 2050, with 64 of the 194 countries still at or above it that year and Chad still first, at 3.85. Those are projections from a model, and the survey gaps above show how far they can drift. You can download the data as a CSV and hand it to Parity, which turns a spreadsheet into charts when you describe what you want to see.
A rate this high leaves a mark on a population for decades, which is why the same countries reappear among the world's youngest populations, and why several at the low end, including South Korea, Japan and Italy, appear among the oldest.
Sources
- UN DESA Population Division, World Population Prospects 2024 (Demographic Indicators, medium variant, CSV): The newest edition: the next was postponed from 2026 to 2027. Total fertility rate by year; estimates to 2023, medium-variant projections after. © United Nations, CC BY 3.0 IGO.
- UN DESA Population Division, World Fertility 2024: Replacement level, and the UN's account of why rates fall.
- The DHS Program, STATcompiler and API (ICF, with national statistics offices): Survey fertility rates, ideal family size and modern contraceptive use, national and by zone or state.
- UNFPA Somalia, Somali Health and Demographic Survey 2020: Somalia's national survey rate.
- CIA World Factbook, Total fertility rate (2024 estimates, final edition via the Wayback Machine): US government work, public domain. Used for the comparison only.
- Natural Earth country boundaries via world-atlas (1:50m): Public domain. Used for the maps only.