
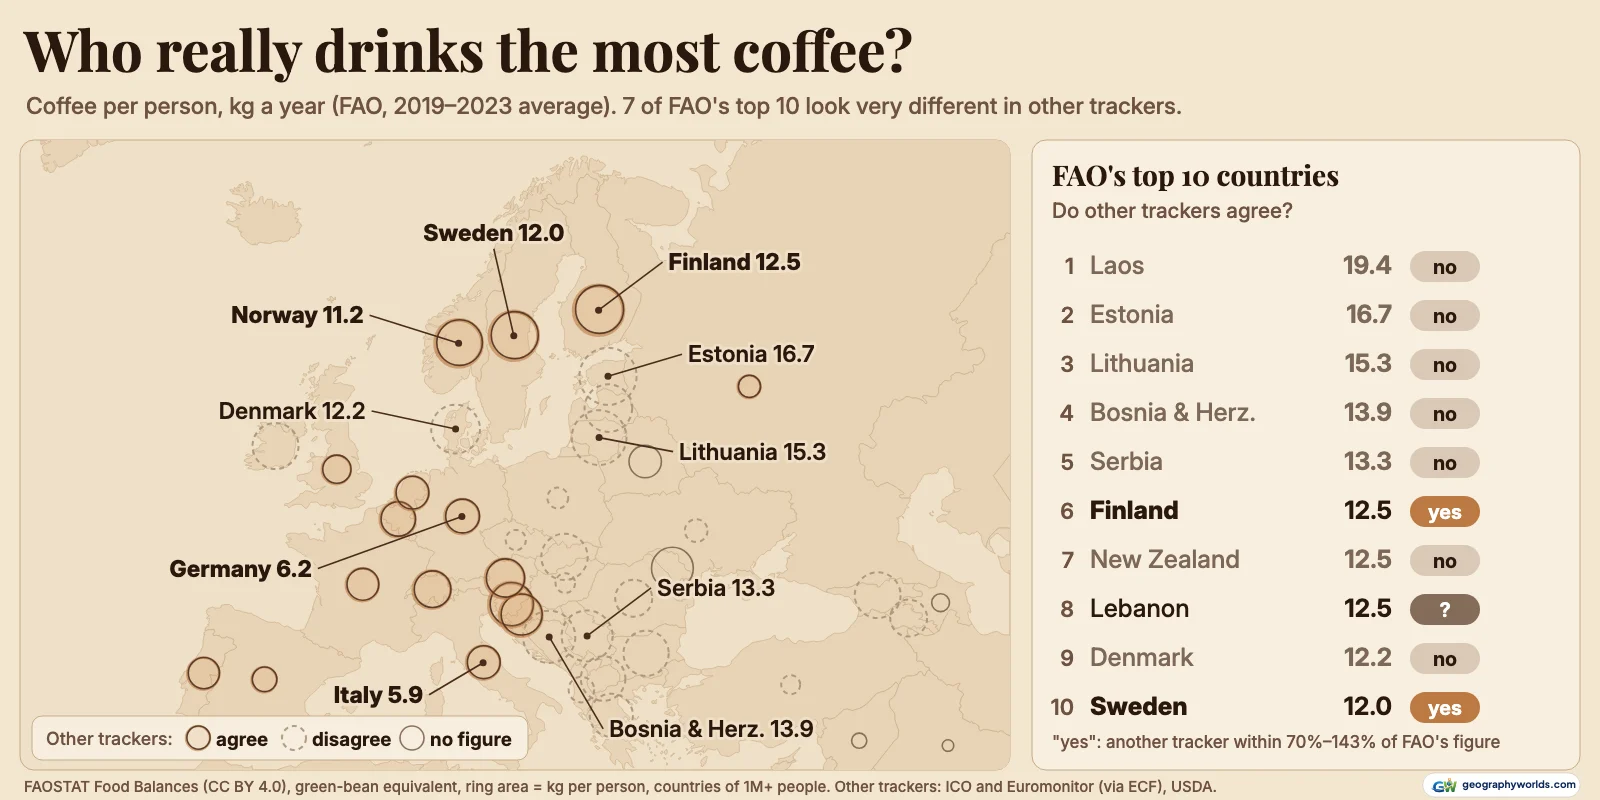
Finland drinks the most coffee per person of any country whose figure survives a second source: 12.5 kg a year in FAO's food balance sheets (2019–2023 average, green-bean weight) and 10.5 kg in 2023 in International Coffee Organization (ICO) data. Sweden (12.0 kg) and Norway (11.2 kg) follow. FAO's raw table puts Laos, Estonia, Lithuania, Bosnia and Herzegovina and Serbia above Finland, but second sources put each at under 70% of FAO's figure. By total volume the United States drinks the most: 1.61 million tonnes in 2023, ahead of Brazil's 1.38 million.
Every "most coffee" ranking rests on one of a few ledgers, and they rarely agree. FAO's food balance sheets cover the most countries, so they are our starting point. Their "food supply" is not a survey of cups. It is apparent consumption: production plus imports, minus exports, stock changes and other uses, divided by the resident population, with roasted and instant coffee converted back to the green beans they came from. FAO's own handbook warns that these are quantities reaching the consumer and that the amount actually consumed may be lower. So we set each country's FAO figure beside three other sources and keep only the figures that a second reading puts within 70% to 143% of FAO's. That threshold is our own choice, but the answer does not hang on it: Finland stays first at any cutoff from 67% to 83%, and down to 51% unless Estonia, whose sales have no roasted-instant split, is assumed to sell nothing but instant.
The ranking that survives a second look
We averaged five years, 2019–2023, because a single year of a balance sheet can jump by close to a fifth: Finland's figure rose 17% in 2019 and fell 19% in 2020. Of the 142 countries with at least 1 million people, 90 could be checked against ICO figures published by the European Coffee Federation (ECF), Euromonitor sales volumes in the same ECF report, or USDA's consumption estimates. Of those, 34 held up.
Finland leads that list, 0.5 kg ahead of Sweden. Lebanon, at 12.48 kg, sits a whisker below Finland in FAO's table, but none of the sources we used covers it, so it stays unchecked rather than ranked. The same goes for Qatar and Moldova.
Myth 1: the top of the table is where the heaviest drinkers live
Read FAO's per-person column straight down and the leader is Laos, at 19.4 kg. That would be more coffee per head than Finland in a country where USDA estimates domestic use at 80,000 to 100,000 60-kg bags a year, about 0.7 kg per person. Laos grows coffee, much of it on the Bolaven Plateau, and FAO records 184,000 tonnes of production in 2023. Its food figure is whatever that estimate leaves after exports, so when production is overstated the surplus lands in the "food" column.
Estonia (16.7 kg) and Lithuania (15.3 kg) come next. Euromonitor's sales figures, which count coffee sold through shops and cafés, convert to 6.1 kg per person in Lithuania once roasted coffee is scaled by the ICO factor of 1.19 and instant by 2.6. Estonia's 5,900 tonnes of sales have no roasted-instant split, so the conversion gives a range, 5.1 to 11.2 kg, below FAO's figure whichever way it falls. FAO's own trade columns show Lithuania re-exporting 60% of what it imported in 2023, and in a balance sheet any onward trade the customs records miss is counted as drunk.
For Bosnia and Herzegovina (13.9 kg) and Serbia (13.3 kg), USDA's estimates come to 5.8 and 6.7 kg, below its own figure for Norway (8.4 kg). New Zealand drops from 12.5 kg to 5.8 kg the same way.
| FAO rank | Country | kg/person, 2019–2023 avg | kg/person, 2023 | Closest second reading (kg) | Holds up? |
|---|---|---|---|---|---|
| 1 | Laos | 19.4 | 22.6 | USDA 0.7 | no |
| 2 | Estonia | 16.7 | 15.7 | Euromonitor, at most 11.2 | no |
| 3 | Lithuania | 15.3 | 13.4 | Euromonitor 6.1 | no |
| 4 | Bosnia and Herzegovina | 13.9 | 14.3 | USDA 5.8 | no |
| 5 | Serbia | 13.3 | 12.2 | USDA 6.7 | no |
| 6 | Finland | 12.5 | 10.8 | ICO 10.5 | yes |
| 7 | New Zealand | 12.5 | 12.8 | USDA 5.8 | no |
| 8 | Lebanon | 12.5 | 12.9 | none found | unchecked |
| 9 | Denmark | 12.2 | 11.7 | ICO 7.4 | no |
| 10 | Sweden | 12.0 | 10.9 | Euromonitor 9.9 | yes |
| 11 | Cyprus | 11.9 | 12.1 | Euromonitor 2.9 | no |
| 12 | Latvia | 11.5 | 12.2 | Euromonitor, at most 6.8 | no |
| 13 | Norway | 11.2 | 10.6 | USDA 8.4 | yes |
| 14 | Slovakia | 11.0 | 10.6 | Euromonitor 4.2 | no |
| 15 | Qatar | 10.9 | 9.8 | none found | unchecked |
Two places are left out of the country ranking by definition. Hong Kong, a territory, averages 19.4 kg, pulled up by 2023, when FAO records 420,000 tonnes of imports against 152,000 tonnes the year before and a per-person figure of 43.2 kg. Luxembourg (22.0 kg) and the Maldives (21.3 kg) have fewer than a million residents. FAO divides by residents only. Its handbook leaves tourists out of the population and moves food eaten mainly by tourists out of the food column; the current file has a tourist-consumption line for this, but fills it for some countries only: the Maldives' balance deducts 0 to 1,000 tonnes a year for tourists against about 11,000 tonnes of food, and Luxembourg's has no tourist figure at all. Yle, Finland's public broadcaster, reports that Luxembourg's high sales come from Germans crossing the border to buy coffee; Euromonitor's figures imply about 5.4 kg per resident.
Myth 2: Finland tops every table, every year
Finland led FAO's table of countries with over 1 million people only once in the fourteen years from 2010 to 2023, in 2011. Its rank has run from 1 to 15, and in 2023 it stood 15th at 10.8 kg, its lowest figure in the series; its highest was 16.1 kg in 2019.
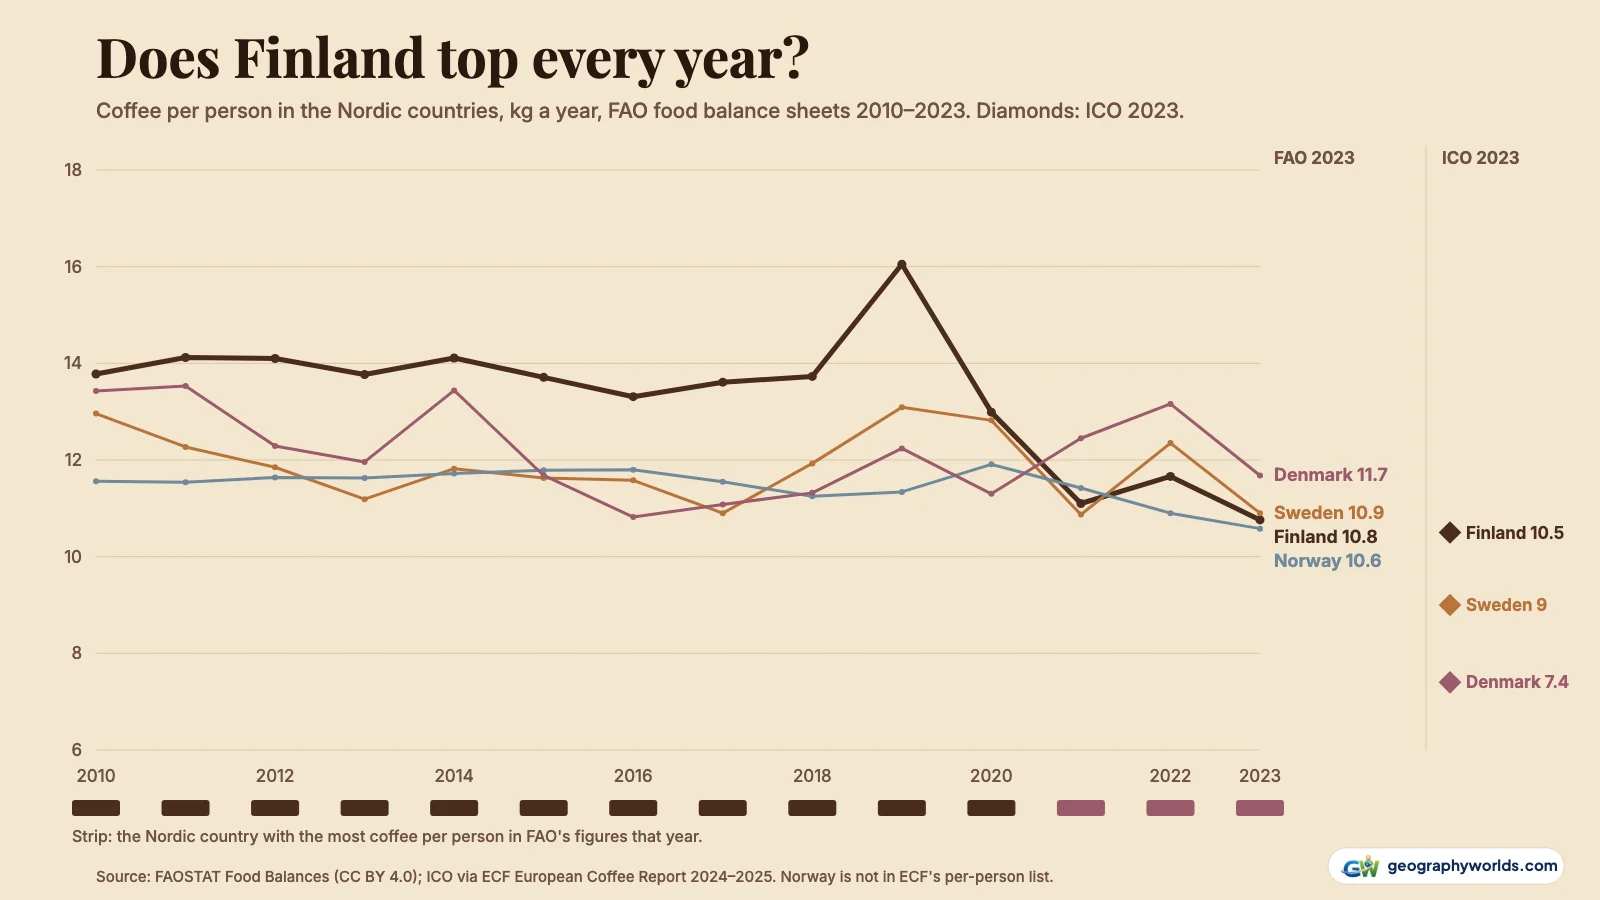
Among the Nordic countries, Finland was first in FAO's figures for eleven straight years, then gave way to Denmark in 2021, 2022 and 2023. Denmark's recent lead does not survive the cross-check: ICO puts Denmark at 7.4 kg in 2023 and Euromonitor's sales convert to 7.0 kg, against FAO's 11.7 kg. ICO keeps the familiar order, Finland 10.5 kg, Sweden 9.0 kg, Denmark 7.4 kg. Euromonitor does not quite: converted to green beans, its 2024 sales give Sweden 9.9 kg and Finland 9.4 kg. Those sales include cafés and restaurants, which take 31% of Sweden's volume against 18% of Finland's. So "Finland, every year" is a strong habit in the data, not a law.

Myth 3: Americans drink the most coffee
In total, yes. Every ledger puts the United States first among countries: 1.61 million tonnes in 2023 according to ICO, 1,431,000 tonnes in FAO's 2023 balance and 23.5 million bags (1,413,000 tonnes) in USDA's 2023/24 estimate. Only the European Union taken as a bloc drinks more, 2.53 million tonnes.
| Country | ICO 2023 (t) | FAO 2023 food supply (t) | USDA 2023/24 (t) |
|---|---|---|---|
| United States | 1,610,000 | 1,431,000 | 1,413,000 |
| Brazil | 1,380,000 | 1,061,000 | 1,330,000 |
| Germany | 520,000 | 449,000 | EU total only |
| Japan | 417,000 | not in file | 420,000 |
| Indonesia | 367,000 | 78,000 | 287,000 |
| France | 354,000 | 346,000 | EU total only |
| Italy | 327,000 | 363,000 | EU total only |
| Russia | 293,000 | 186,000 | 255,000 |
| Vietnam | 254,000 | 387,000 | 234,000 |
| Canada | 243,000 | 269,000 | 299,000 |
| United Kingdom | 225,000 | 343,000 | 251,000 |
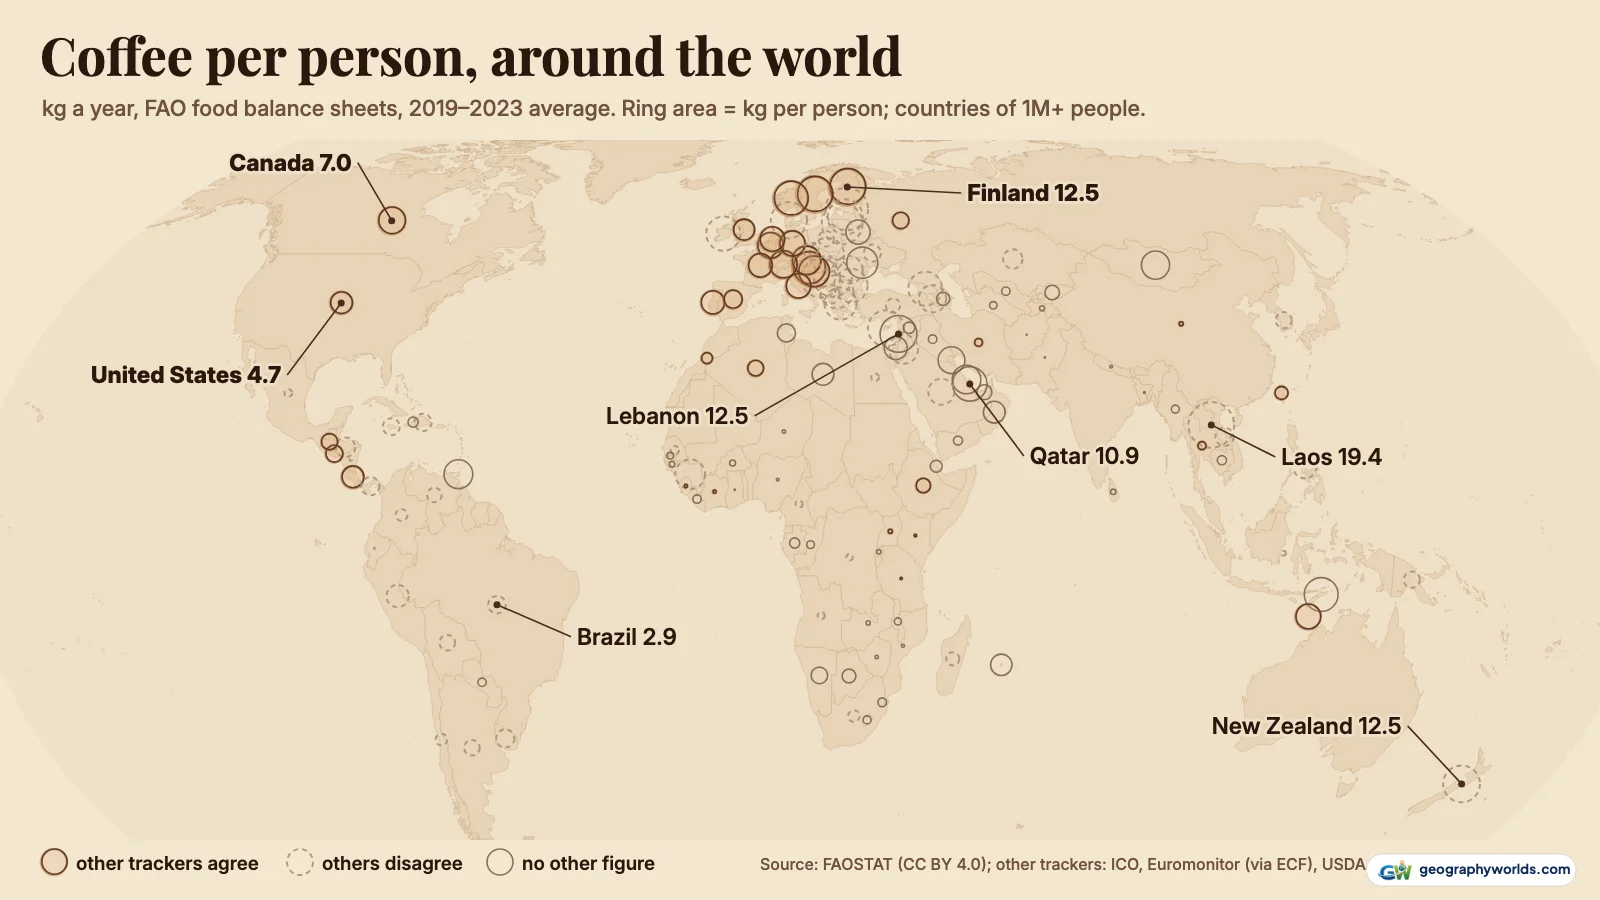
Per person, the picture flips. The United States averages 4.7 kg in FAO's figures and 4.8 kg in ICO's, which puts it 47th of 142 countries, behind Canada (7.0 kg) and well behind the Nordic countries. FAO's file has one more gap worth knowing: it has no rows at all for Japan, which ICO puts at 417,000 tonnes in 2023, Asia's largest market.
Myth 4: Italy drinks the most coffee in Europe
Italy is Europe's espresso reference, yet ICO puts Italians at 5.5 kg per person in 2023, below Germany (6.2 kg) and far below Finland. FAO's figure is similar, 5.9 kg, 40th among the 142 countries. In total tonnage Italy (327,000 tonnes) ranks third in the EU, behind Germany (520,000) and France (354,000). FAO and ICO agree to within about a tenth; Euromonitor's sales, converted to green beans, come to less, 3.9 kg.
Myth 5: coffee-growing countries ship nearly all of it abroad
Brazil, the world's largest grower, is also the second-largest consumer. ICO puts its 2023 consumption at 1.38 million tonnes, 13% of the world total, and 6.4 kg per person, the highest of any major market in the ECF's list when the EU is treated as one bloc. USDA's 2023/24 estimate, 22.2 million bags, is close.
FAO's balance struggles with Brazil for a structural reason. In 2023 it records 3,405,000 tonnes of production and 2,405,000 tonnes of exports; food is the small remainder after stock changes, so a modest error in either big number swings it wildly. Brazil's per-person figure runs from 0.03 kg in 2014 to 6.2 kg in 2018, and its five-year average, 605,000 tonnes a year, is less than half of ICO's figure. For the producing side of the story, see our ranking of the countries that produce the most coffee.
Belgium, the Netherlands and Switzerland: where re-exports bend the ledger
Belgium re-exported 78% of its coffee imports in 2023 and the Netherlands 79%, by FAO's own trade figures. Their per-person figures wobble accordingly: Belgium between 4.8 and 8.8 kg across 2010–2023, the Netherlands between 1.5 and 7.0 kg. Belgium's five-year average, 6.4 kg, still lands close enough to Euromonitor's 4.8 kg to pass our test, but any single year is a gamble.
Switzerland shows that heavy trade alone does not break a balance sheet. It re-exported 71% of its imports in 2023, yet FAO's 7.3 kg sits close to USDA's 7.8 kg. The trouble starts when onward trade goes unrecorded, or when production is guessed, not when it is large.
How the numbers were checked
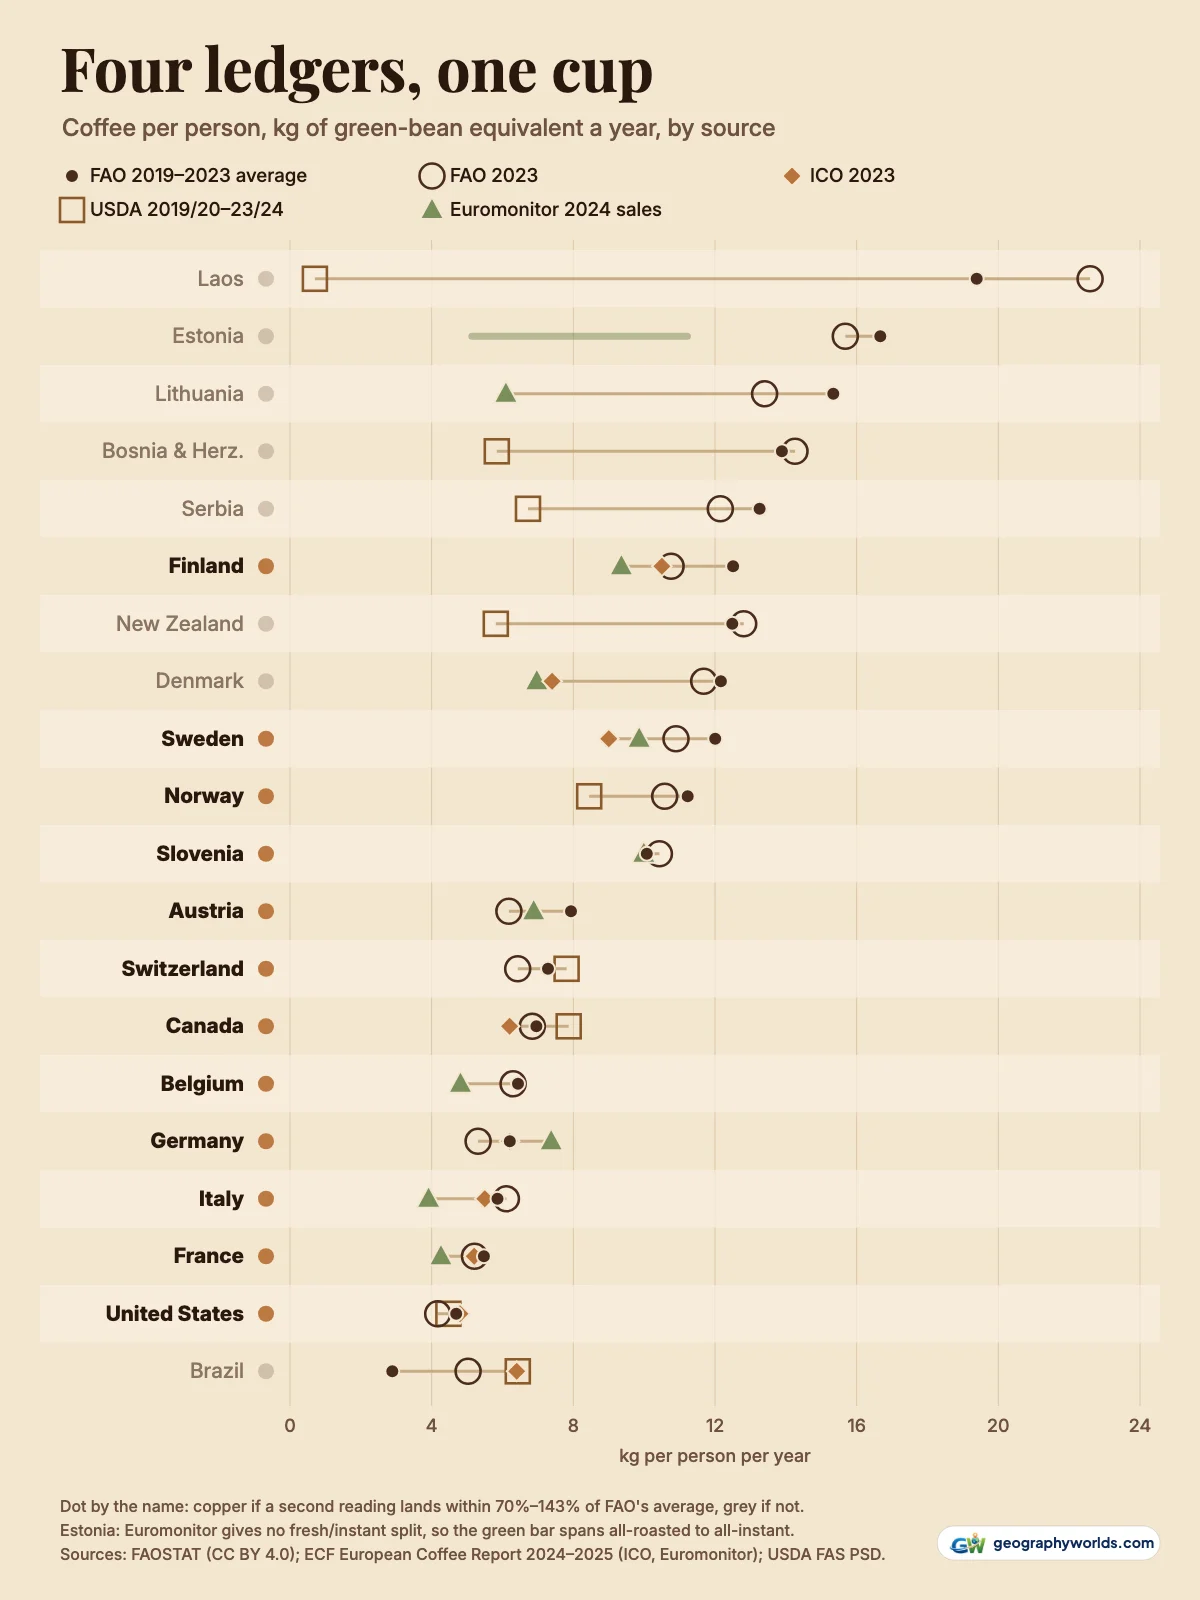
FAO figures are from the Food Balances (2010–) bulk file of 28 October 2025, item "Coffee and products", which runs to 2023. Regional totals are removed, Hong Kong and Macao are treated as territories, and the ranking covers countries of 1 million people or more. A figure holds up when at least one second reading falls between 70% and 143% of FAO's 2019–2023 average. Second readings are ICO's 2023 per-person figures as printed in the ECF's European Coffee Report 2024–2025; Euromonitor's 2024 sales in the same report, converted to green beans with the ICO factors the report gives (1.19 for roasted, 2.6 for instant) and divided by FAO's 2023 population; and USDA's domestic consumption for 2019/20 to 2023/24, in 60-kg bags, for countries outside the EU, since USDA reports the EU as one block. 52 countries had no second reading. Cups are left out on purpose: grams per cup vary too much by brewing method to convert honestly.
You can download the data as a CSV: all 176 countries and territories, FAO's per-person figure for every year since 2010, 2023 imports and exports, and each second reading with its verdict. Euromonitor's figures are quoted from the ECF report, not included in the file; where Euromonitor gives a country's closest second reading, the file names the source and leaves the value to the report.
- FAO, FAOSTAT Food Balances (2010–), item "Coffee and products": food supply (kg per person per year), food, imports, exports and population, 2010–2023; bulk file of 28 October 2025; CC BY 4.0 (FAO database terms of use)
- European Coffee Federation, European Coffee Report 2024–2025: ICO consumption figures for 2023 (totals and per person) and Euromonitor International sales volumes for EU countries, 2022–2024; quoted, not redistributed
- USDA Foreign Agricultural Service, PSD Online coffee data: domestic consumption by marketing year in thousand 60-kg bags, green-bean equivalent; US government work, public domain
- FAO, Food Balance Sheets: A Handbook (2001)
- Natural Earth country outlines (via world-atlas): public domain
To trace the beans in these cups back to the farms and climates that grow them, read our guide to the geography of coffee origins.