
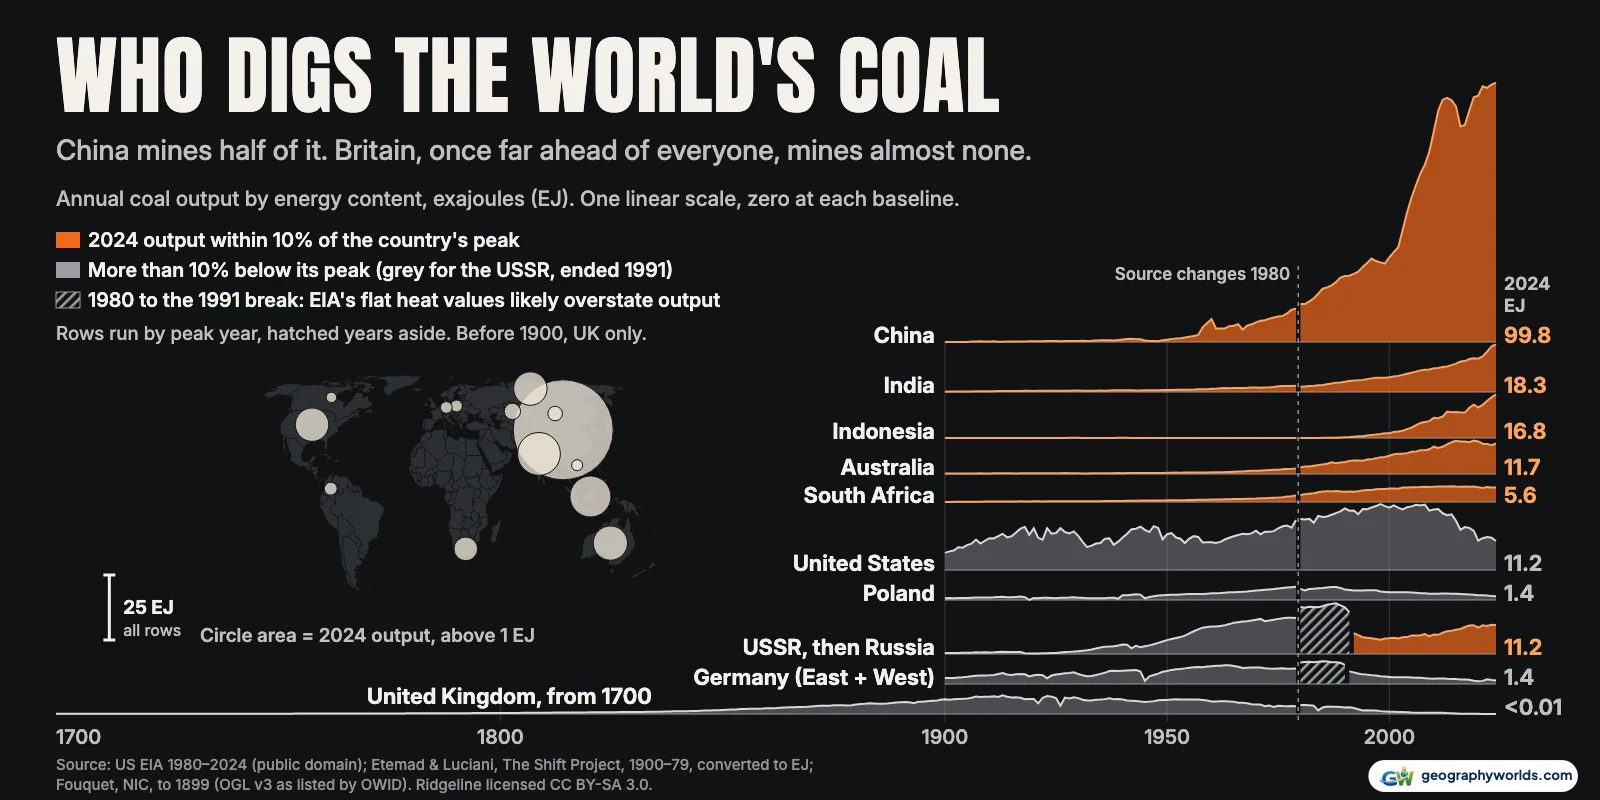
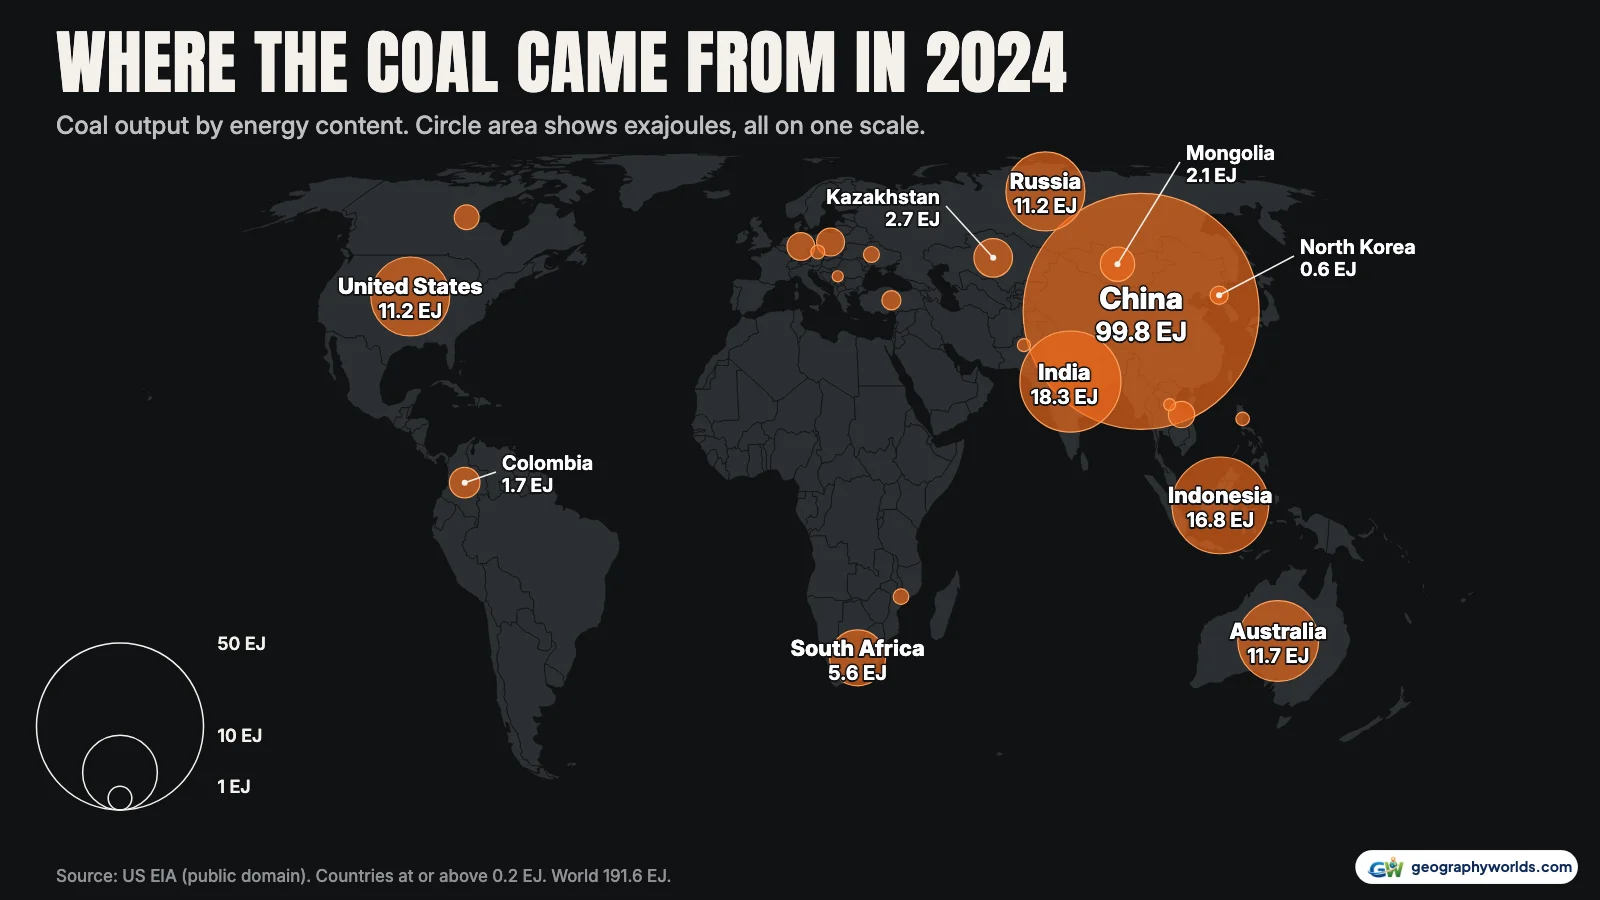
China produces the most coal of any country, by a wide margin: 99.8 exajoules (EJ) of energy content in 2024, or 4,403 million tonnes (Mt), which is 52.1% of the world's coal energy and 50.0% of its weight, according to the US Energy Information Administration (EIA). India is second (18.3 EJ, 1,013 Mt) and Indonesia third (16.8 EJ, 836 Mt), so those three Asian countries dig 70% of the world's coal energy. Australia, Russia and the United States are almost level behind them, with South Africa seventh.
That ranking is recent. In 1950 China, India and Indonesia together made 4% of the world's coal. This piece follows the lead as it moved from Britain through Europe, the United States and the Soviet Union to Asia, ending with who is opening new mines and who has shut their last one. It covers where coal is dug, not what burning it emits.
| Rank | Country | Energy (EJ) | Share of world energy | Million tonnes | GJ per tonne | Rank by weight |
|---|---|---|---|---|---|---|
| 1 | China | 99.77 | 52.1% | 4402.5 | 22.7 | 1 |
| 2 | India | 18.30 | 9.6% | 1012.9 | 18.1 | 2 |
| 3 | Indonesia | 16.77 | 8.8% | 836.0 | 20.1 | 3 |
| 4 | Australia | 11.73 | 6.1% | 467.7 | 25.1 | 5 |
| 5 | Russia | 11.18 | 5.8% | 476.2 | 23.5 | 4 |
| 6 | United States | 11.16 | 5.8% | 465.0 | 24.0 | 6 |
| 7 | South Africa | 5.59 | 2.9% | 237.4 | 23.6 | 7 |
| 8 | Kazakhstan | 2.66 | 1.4% | 112.9 | 23.6 | 8 |
| 9 | Mongolia | 2.11 | 1.1% | 82.6 | 25.6 | 11 |
| 10 | Colombia | 1.67 | 0.9% | 58.1 | 28.8 | 13 |
| 11 | Poland | 1.40 | 0.7% | 85.2 | 16.4 | 10 |
| 12 | Germany | 1.37 | 0.7% | 91.9 | 14.9 | 9 |
Why a tonne of coal is not one fixed amount
Coal is measured two ways, and they disagree because the rock varies. The EIA ranks coal from anthracite, with the highest heating value, down through bituminous and subbituminous to lignite, the brown coal with the lowest energy content. Tonnes of each are not comparable, so our ranking uses energy content, with tonnes alongside.
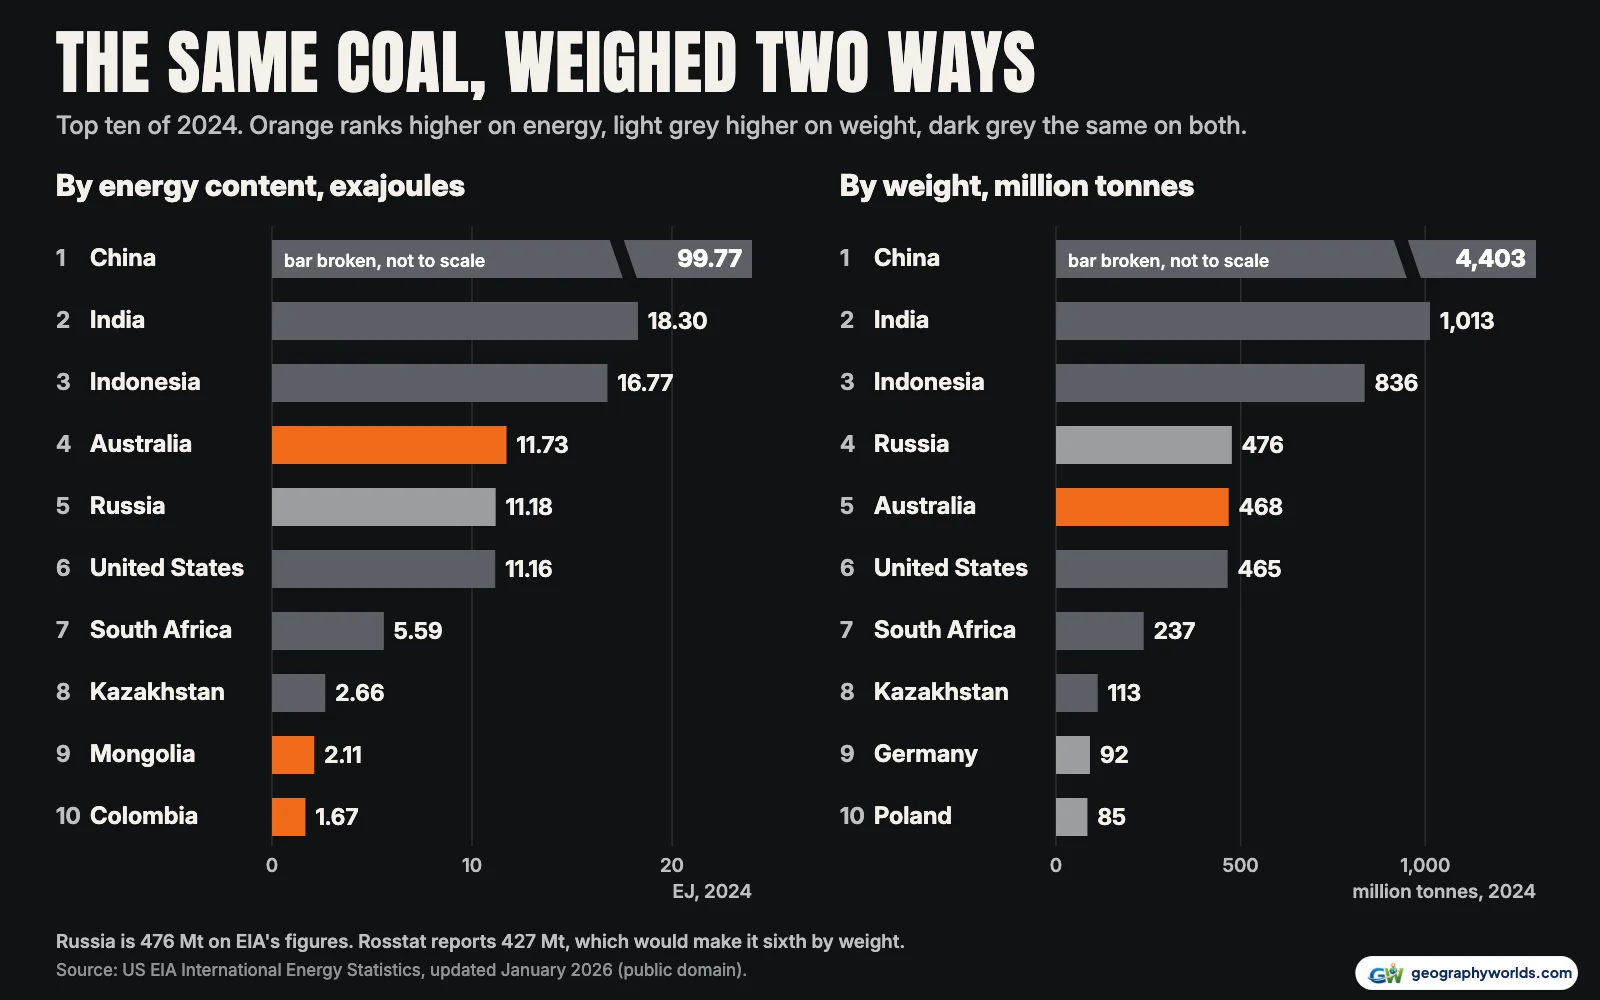
The switch changes the middle of the table. By weight, Germany is 9th and Poland 10th; by energy they fall to 12th and 11th, while Mongolia climbs from 11th to 9th. On EIA's figures Germany's 91.9 Mt carries 1.37 EJ, about 14.9 gigajoules (GJ) per tonne, against Australia's 25.1 GJ. The Energy Institute puts Germany lower still, at 0.83 EJ.
Fourth place is the closest contest of all. Australia (11.73 EJ), Russia (11.18 EJ) and the United States (11.16 EJ) sit within a few percent of each other, and on weight the order flips to Russia (476 Mt), Australia (468 Mt) and the United States (465 Mt). The Energy Institute's 2026 Review has Australia at 11.71 EJ, the US at 10.60 EJ and Russia at 9.12 EJ for 2024, and the US ahead of Australia in 2025 (11.04 EJ to 10.89 EJ). Rosstat, meanwhile, reports 427 Mt for Russia, which would make it sixth by weight. Australia leads on every 2024 measure; Russia's place depends on the source.
Britain, alone at the start
Britain's record runs back to 1700, two centuries further than any other country's in our data. By 1850 it was digging 1.56 EJ, against a world estimate of 2.05 EJ, or roughly 76%. That share is rough: it divides Roger Fouquet's British series by Vaclav Smil's world series, which for 1800 do not fit at all, putting Britain (0.38 EJ) above the world (0.35 EJ). Why coal mattered so much there is covered in our guide to the geography of the Industrial Revolution.
Output peaked in 1913 at 292 Mt (7.2 EJ), from 3,024 deep mines, according to the UK government's historical coal tables. Employment topped out in 1920 at 1.19 million people. In 2025 the same table records 0.12 Mt, 3 deep mines and 280 workers. Yet Britain had already lost first place: by 1900, the first year our cross-country series covers, the United States stood at 6.6 EJ to Britain's 5.6 EJ.
Germany and Poland: Central Europe's two coalfields
Germany ranked third in 1900, at 2.3 EJ. Its hard coal has gone: Prosper-Haniel in Bottrop, the last black coal mine, closed in December 2018 because imports were cheaper. Lignite keeps Germany in the top ten by weight.
Poland rose later, from 1.9 EJ in 1950 to 5.1 EJ in 1979, and now produces 1.40 EJ. EIA has Germany about level; the Energy Institute has Poland well ahead, 1.40 EJ to 0.83 EJ.
The United States led in 84 of 85 years
By energy content, the United States was the largest producer in our data in 84 of the 85 years from 1900 to 1984. By 1913 it mined 13.9 EJ to Britain's 7.2 EJ. Its energy output peaked in 1998 at 25.4 EJ, and its tonnage in 2008 at 1,063 Mt; the two differ because the average tonne carried less energy by then, 23.7 GJ against 25.0 GJ. Output has since fallen 56% by weight. The EIA's Annual Coal Report shows production down 11.3% in 2024 alone, to 512.5 million short tons, with 524 mines still producing.
The Soviet Union, and a line that breaks in 1992
The exception was 1961, when the Soviet Union edged ahead for a single year. Output on Soviet territory had gone from 0.8 EJ in 1913 to 5.3 EJ in 1950, and the EIA series peaks at 19.5 EJ in 1988, probably about a quarter too high (see the last section). The gap in that row of the chart is a border change as well as a collapse. From 1992 the data counts Russia alone, at 8.0 EJ, and Kazakhstan separately; it produced 2.7 EJ in 2024. Russia fell to 5.5 EJ in 1998, then climbed back to 11.18 EJ.
China takes first place in 1985
China produced 14.6 EJ in 1980, 17% of the world's total. It passed the United States on energy in 1985 (1989 on Energy Institute figures); by weight it first edged ahead in 1983 and for good in 1985. Its share of world coal energy peaked at 54.3% in 2021 and has eased only slightly. The dip on its ridge after 2013 is real: the EIA shows three years of falling output, a recovery past 2013 by 2019, and a new high in 2024. Production is concentrated in the north and northwest: Shanxi, Inner Mongolia, Shaanxi and Xinjiang made 81.7% of national output in 2025, by a tally of official statistics.
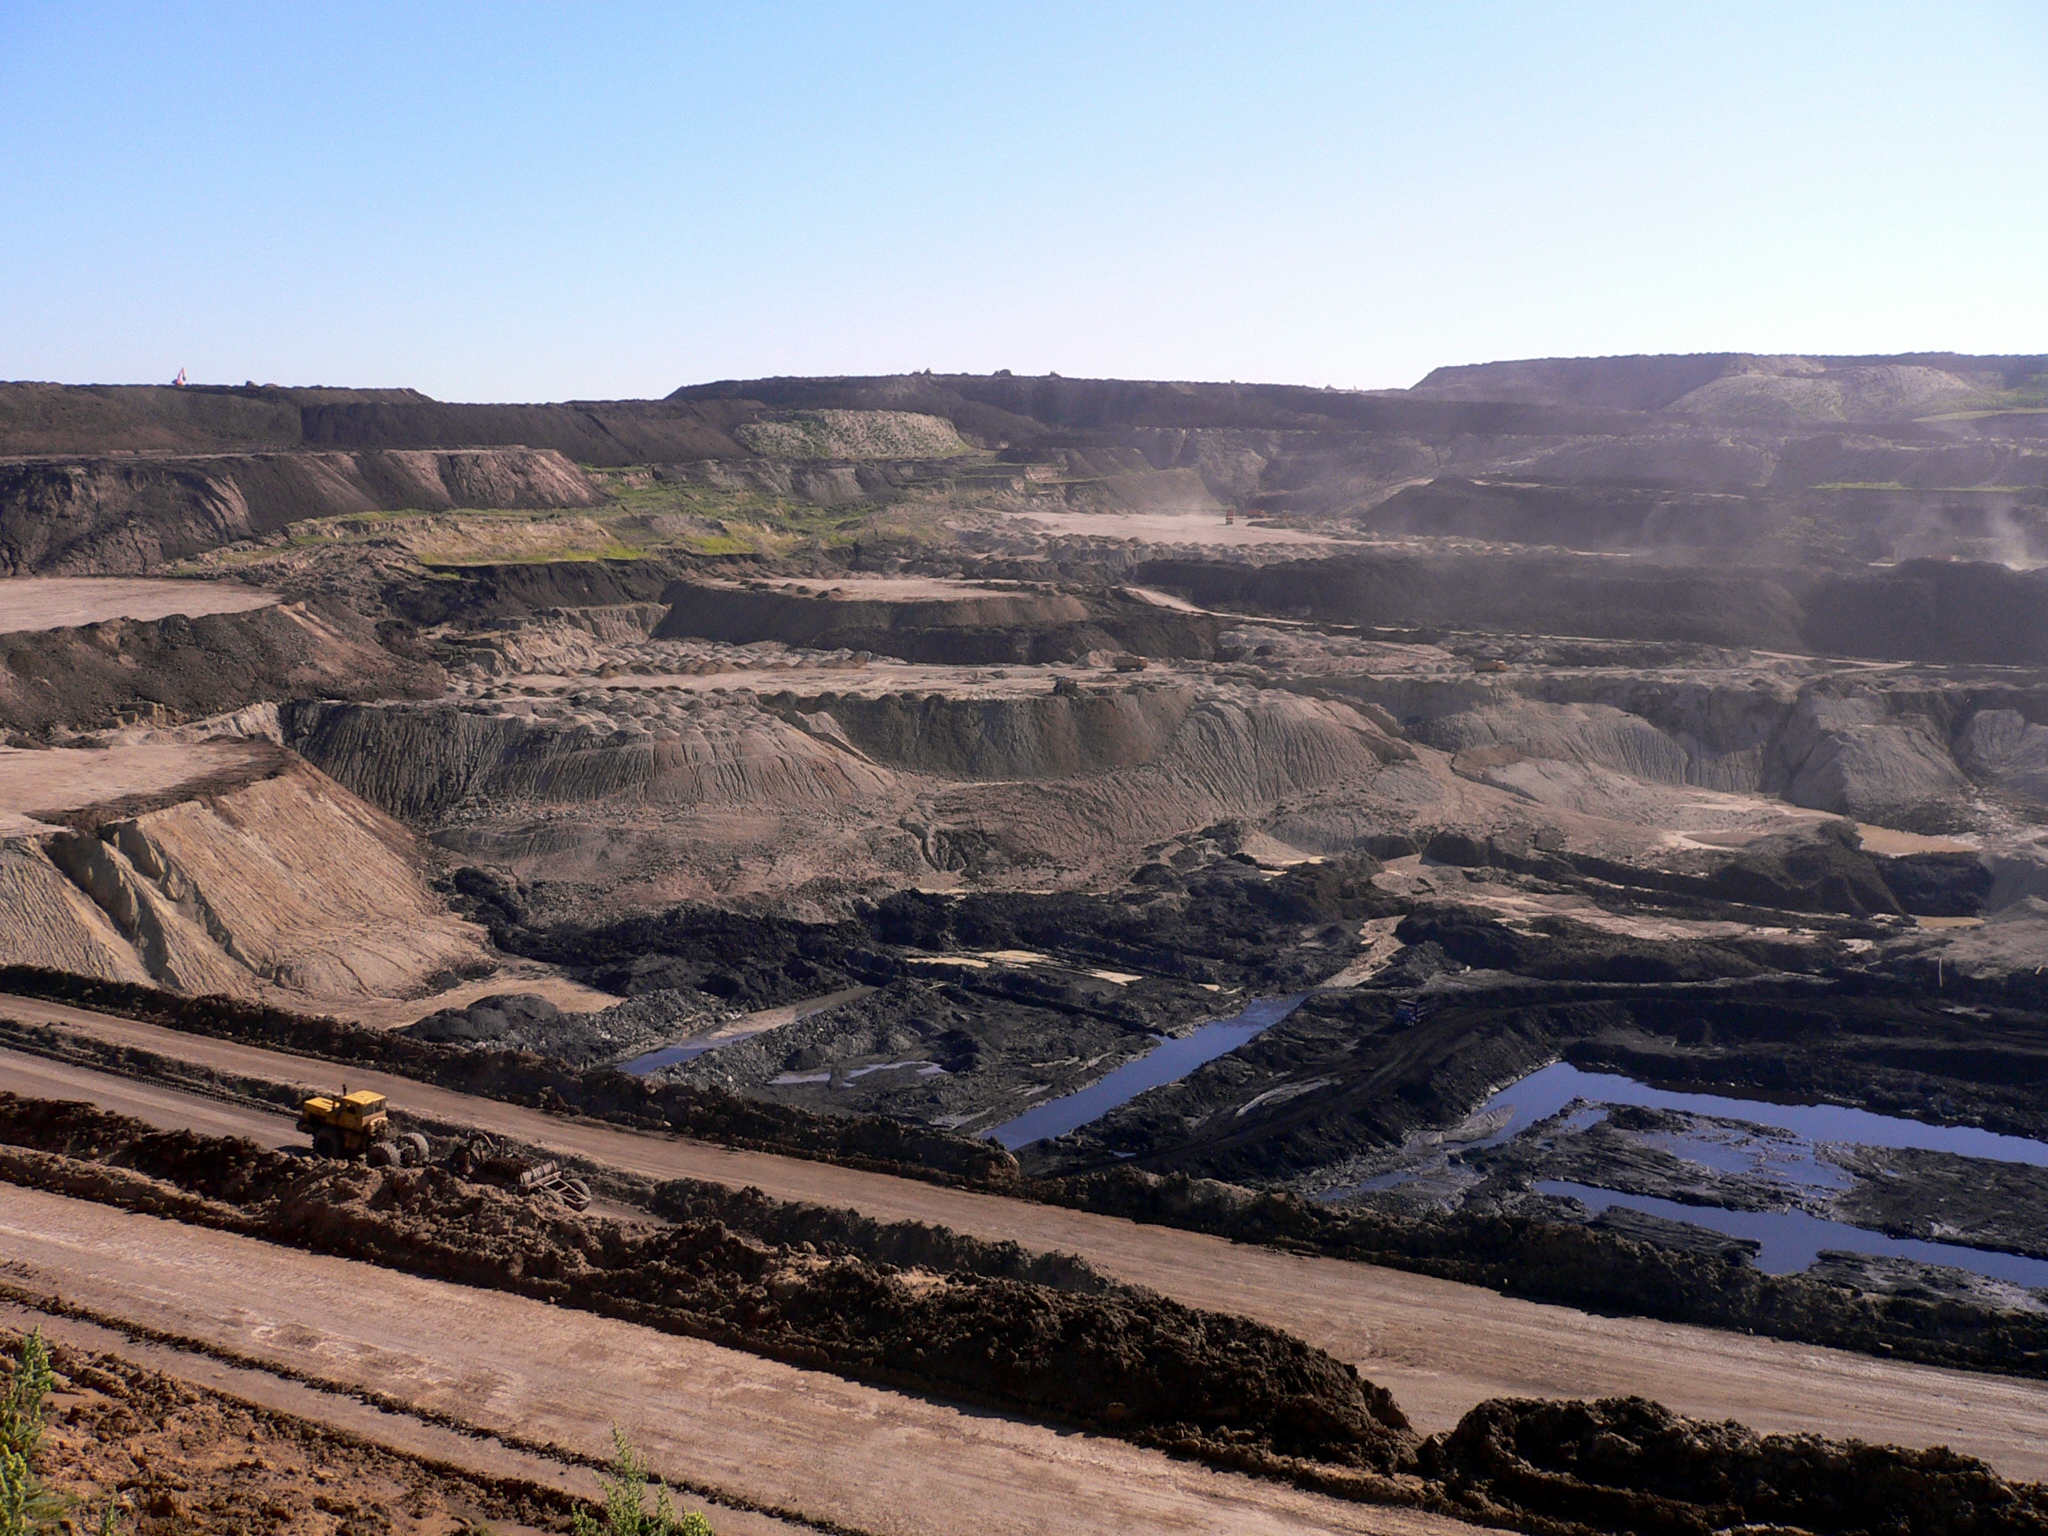
This is also the number sources most dispute. The EIA's 4,403 Mt sits about 6% below the International Energy Agency's 4,666 Mt and further below the 4.76 billion tonnes from China's statistics bureau; the EIA's world total of 8.8 billion tonnes also trails the IEA's 9.1 billion. The IEA's figures still give China about half.
India's billion tonnes and Indonesia's climb
India has multiplied its energy output about 9 times since 1980, from 2.0 EJ to 18.3 EJ, with 5.5 EJ of that gain since 2020. In the 2024-25 fiscal year, which runs from April to March, the Ministry of Coal reported over 1,047 Mt. The window does not explain the gap with the EIA's calendar-year 1,013 Mt, since the IEA's calendar-2024 figure is 1,082 Mt.
Proportionally, Indonesia's rise is the steepest on the chart. It mined just 0.26 EJ in 1990 and 1.9 EJ in 2000, and 16.8 EJ in 2024, about 65 times the 1990 figure.
Australia and South Africa, past their highs
Australia went from 2.5 EJ in 1980 to 12.8 EJ in 2019. South Africa peaked at 6.0 EJ in 2014 and produced 5.6 EJ in 2024, 87% of all African coal by energy.
Who is still opening mines, and who has closed the last one
The earliest coal nations closed first. Britain's last deep colliery, Kellingley, shut on 18 December 2015, although the government table still counts three tiny deep mines, and Ffos-y-fran, the last opencast site, stopped in late 2023. Germany's law ends coal-fired power by 2038 at the latest, and a 2021 agreement in Poland expects thermal coal mines to shut by 2049, subject to EU approval.
Elsewhere the pipeline is still growing. Global Energy Monitor's Still Digging 2026 report counts 2,521 million tonnes a year of proposed mine capacity in 2025, up 11% in a year, with China at 1,321 Mt and India at 638 Mt, nearly double its 329 Mt a year earlier, mainly in Jharkhand and Odisha. Proposals are not mines: only about 113 Mt of new capacity actually opened in 2025, nearly 40% less than in 2024, and about 1,145 Mt of operating capacity is scheduled to retire by 2035.
New South Wales said in March 2026 that it will no longer accept applications for new greenfield mines, while still considering extensions to existing ones. Indonesia has lowered its 2026 production target to 641 Mt, according to the IEA, which also forecasts a record 1,095 Mt for India in 2026. The 2026 figures are forecasts and targets, not results.
How the chart was put together
All 2024 figures come from the EIA's public-domain file, last updated for coal on 28 January 2026. Before 1980 the ridgeline uses Etemad and Luciani's estimates from The Shift Project, converted to EJ, and before 1900 Fouquet's series for Britain alone, so other rows begin abruptly. The ridgeline is therefore CC BY-SA 3.0. The Energy Institute requires permission for extensive reproduction, so its Review is only quoted.
The sources do not join cleanly, so the chart leaves a gap at 1980. Across it Germany's line moves +39%, the USSR's +31%, Australia's +21%, Britain's +16%, China's +14%, Poland's −16% and India's −17%. Much of each step is differing heat assumptions, not a real one-year change: Britain's actual tonnage rose only 6%, from 122.4 Mt to 130.1 Mt. EIA runs 23-25% above the Energy Institute for the USSR and 36-43% for Germany in 1981-84, so those years are hatched: EIA uses one flat heat value for the USSR, and for East and West Germany alike, falling from 16.9 to 13.8 GJ per tonne at 1991. Germany's row is East plus West throughout.
You can download the data as a CSV: 3,929 rows of annual output, each labelled with its source and licence. Paste it into Parity if you want to redraw the ranking by tonnes. The sources were:
- US Energy Information Administration (Oct 2026), International Energy Statistics, bulk file INTL.zip: Coal production by country, 1980-2024. Public domain.
- Etemad & Luciani (1991), World Energy Production 1800-1985, machine-readable edition by The Shift Project, compiled by Our World in Data (2026): Country series 1900-1979, converted to EJ. CC BY-SA 3.0, as are those rows of our CSV and the ridgeline.
- Fouquet (2020), A historical energy data set for the UK, National Infrastructure Commission: UK output 1700-1899, via Our World in Data. OGL v3 as listed by OWID.
- Smil (2017), Energy Transitions, 2nd edition, Appendix A: World output, 1800 and 1850, via Our World in Data.
- UK Department for Energy Security and Net Zero (30 July 2026), Historical coal data: coal production, availability and consumption: UK output, mines and employment, 1853-2025. OGL v3.0.
- Energy Institute (2026), Statistical Review of World Energy, via Our World in Data: Quoted comparison only; not charted or in the CSV.
- Natural Earth admin-0 countries via the world-atlas package: Public domain.
For the rocks and basins behind these national totals, continue with our tour of the world's major coalfields, or compare another fuel's shifting leaders in the countries that produce the most oil.