
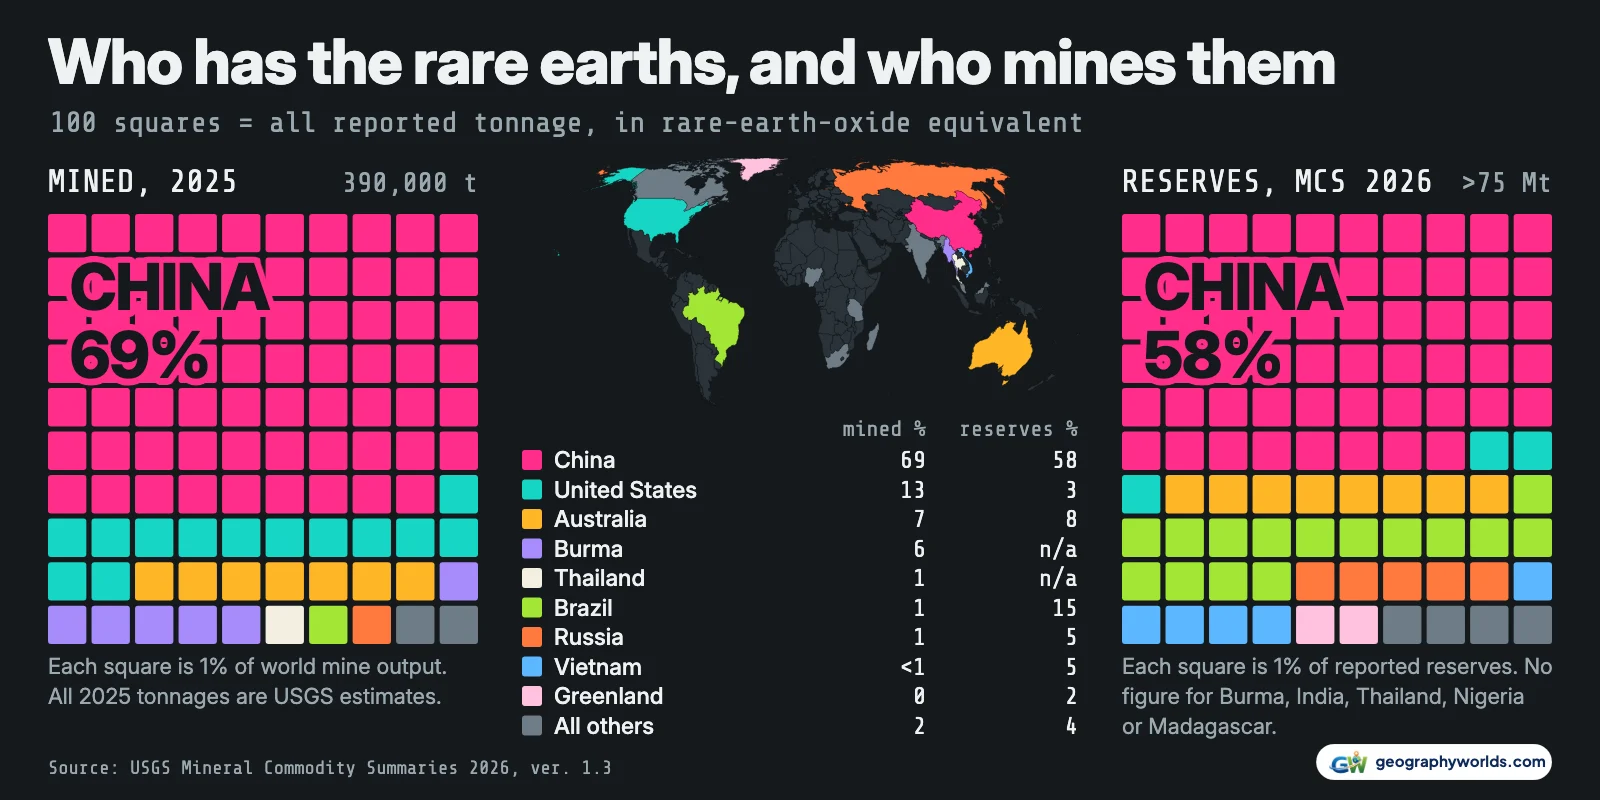
China has the most rare earths, with 44 million tonnes of reserves in rare-earth-oxide equivalent, 58% of the roughly 75 million tonnes the U.S. Geological Survey can count. Brazil is second with 11 million tonnes, then Australia (6.3), Russia (3.8) and Vietnam (3.5). China also mines the most, an estimated 270,000 tonnes in 2025, or 69% of the 390,000-tonne world total, ahead of the United States (51,000), Australia (29,000) and Burma, also called Myanmar (22,000).
Past first place, those two rankings barely resemble each other. Every figure above comes from the USGS Mineral Commodity Summaries 2026, published in February 2026 and corrected in May. All the 2025 production numbers are USGS estimates, and reserves come with larger doubts than the tidy table suggests.
| Country | Reserves (t REO) | Share of reported reserves | Mined in 2025, est. (t REO) | Share of 2025 output |
|---|---|---|---|---|
| China | 44,000,000 | 58.4% | 270,000 | 69.2% |
| Brazil | 11,000,000 | 14.6% | 2,000 | 0.5% |
| Australia | 6,300,000 | 8.4% | 29,000 | 7.4% |
| Russia | 3,800,000 | 5.0% | 2,600 | 0.7% |
| Vietnam | 3,500,000 | 4.6% | 150 | <0.1% |
| United States | 1,900,000 | 2.5% | 51,000 | 13.1% |
| Greenland | 1,500,000 | 2.0% | 0 | 0% |
| Tanzania | 890,000 | 1.2% | 0 | 0% |
| South Africa | 860,000 | 1.1% | 0 | 0% |
| Canada | 830,000 | 1.1% | 0 | 0% |
| Malaysia | 710,000 | 0.9% | 110 | <0.1% |
| Burma | not reported | 22,000 | 5.6% | |
| Thailand | not reported | 4,800 | 1.2% | |
| India | not reported | 2,900 | 0.7% | |
| Madagascar | not reported | 2,700 | 0.7% | |
| Nigeria | not reported | 1,500 | 0.4% |
Brazil has a seventh of the reserves and half a percent of the mining
Brazil holds 15% of reported reserves and mined 2,000 tonnes in 2025, 0.5% of world output. At that pace its reserves would last 5,500 years. Vietnam has 3.5 million tonnes and mined 150 tonnes. Greenland (1.5 million), Tanzania (890,000 tonnes), South Africa (860,000) and Canada (830,000) all appear in the reserves column and mined nothing.
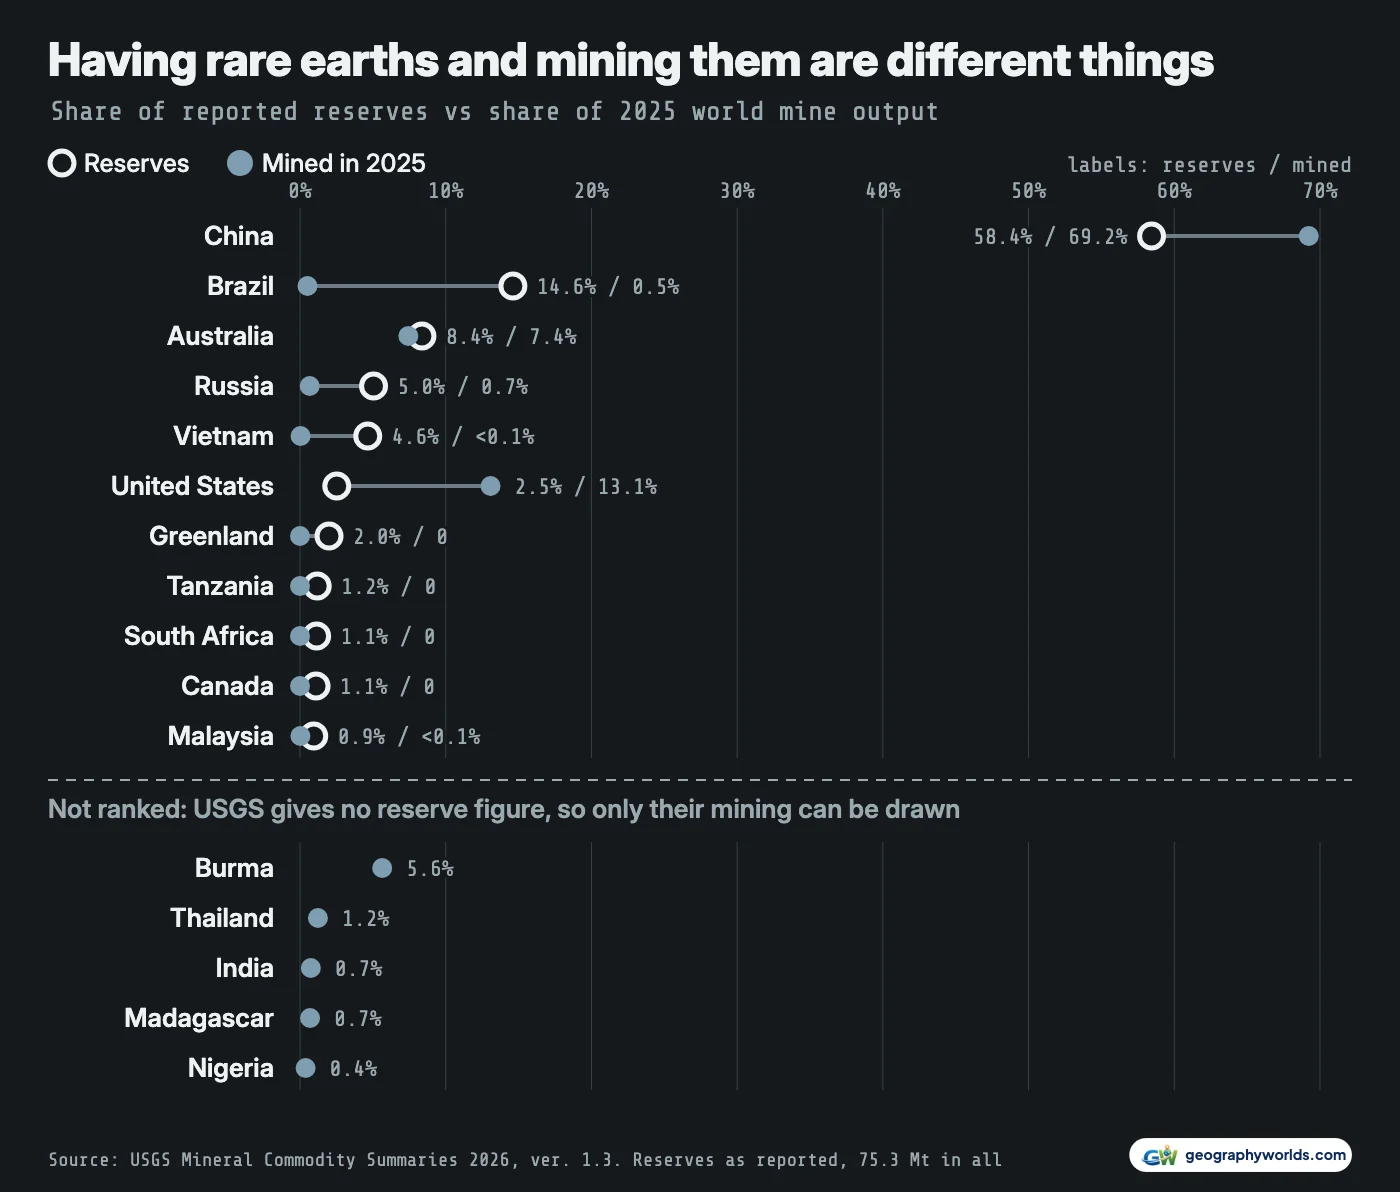
The United States runs the other way. It has 2.5% of reported reserves and 13% of the mining, so at the 2025 rate its 1.9 million tonnes would last 37 years, against 163 for China. Nearly all of that output comes from one pit in California.
Then there are the countries that mine with no reserve figure at all. Burma (22,000 tonnes in 2025), Thailand (4,800), India (2,900), Madagascar (2,700) and Nigeria (1,500) together supplied 9% of world output, and USGS lists "NA" against all five. For Burma, Thailand and Madagascar the output is itself inferred from what China reported importing, so USGS sees those mines only when their concentrate reaches a Chinese port.
From under half to 98%: how China took the mining
China passed the United States in 1992, by 21,300 tonnes to 20,700 on the estimates in USGS's 1994 Minerals Yearbook, up from 27% of world output in 1990. By 1994 it had 54%. A 2002 USGS fact sheet dates "the Chinese era" from about 1991, after a transition that began around 1984.
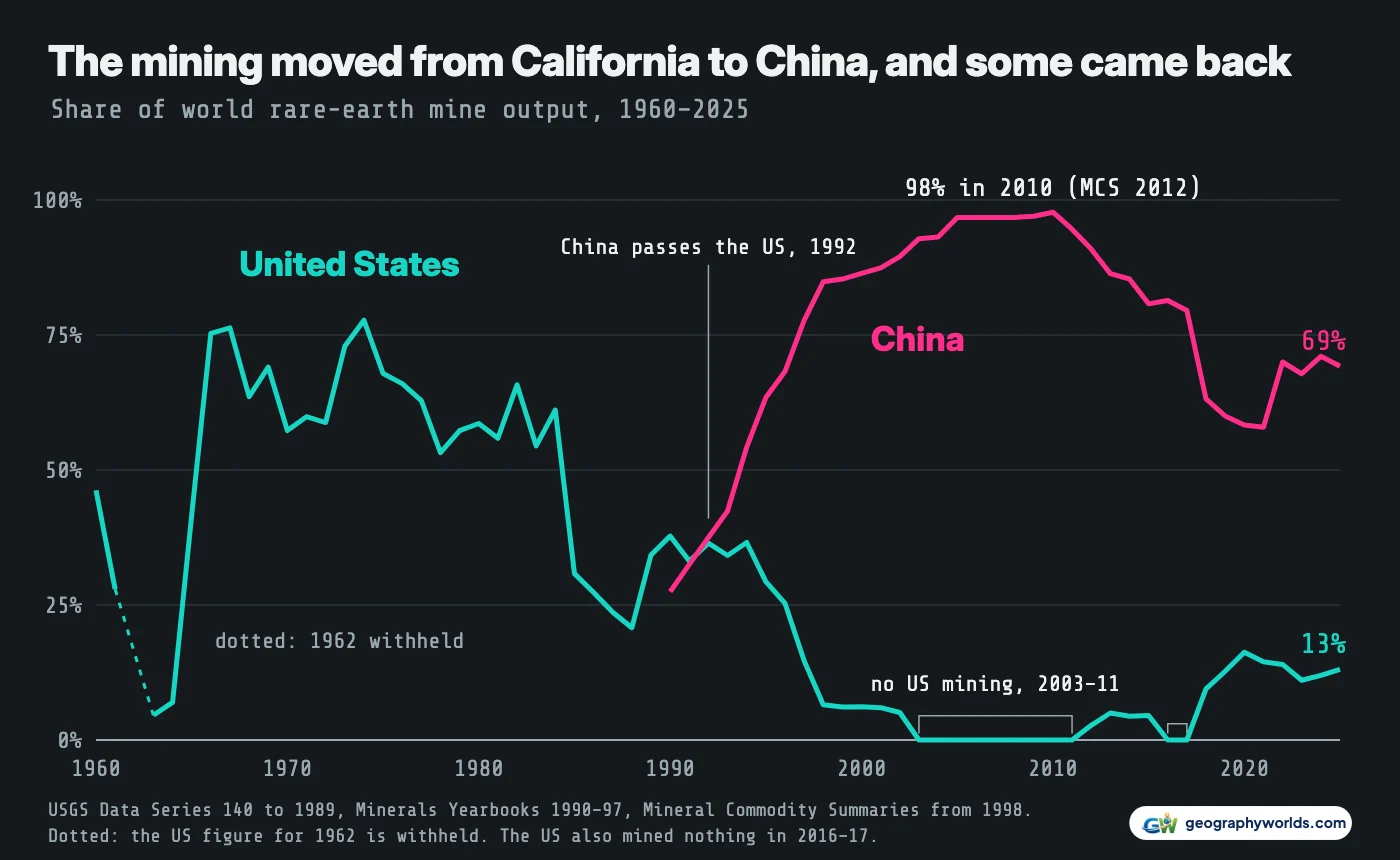
The climb after that is steep: 78% in 1997, 97% in 2005, and in 2010 the 2012 Mineral Commodity Summaries put it at 130,000 tonnes of 133,000, or 98%. USGS's 2013 Yearbook later revised that year to 120,000 of 131,000, 92%. The fact sheet names the causes: much lower labour and regulatory costs, the growth of electronics manufacturing in Asia, the number and size of Chinese deposits, and environmental trouble at the main American mine. The most important Chinese source it names is Bayan Obo in Inner Mongolia, an iron-niobium-rare earth deposit with grades of 3 to 6% oxide.
The position drew a legal challenge. The United States took a case to the World Trade Organization in 2012, and the panel and Appellate Body ruled in 2014 that China's export duties and quotas broke its obligations. USGS recorded the quotas ending in 2015.
The share has fallen since 2010, but not because China mines less. On the 2012 sheet's figures, China has doubled from 130,000 to 270,000 tonnes, while the rest of the world went from about 3,000 tonnes to 120,000. The low point was 58% in 2021; the share was back to 70% a year later and is 69% now. That swing needs care: USGS raised its world total from 132,000 tonnes for 2017 to 190,000 for 2018, and its 2025 edition still warned that China's number was a production quota that left out undocumented mining. Beijing then issued its 2025 quotas without the usual public announcement, which makes the flat 270,000 tonnes for 2025 especially hard to check.
Mountain Pass: the pit that led, closed and returned

Mountain Pass sits in the California part of the Mojave Desert. Prospectors looking for uranium found the deposit in 1949, and small-scale production began in 1952. Colour television made it matter, because its ore supplied the europium for the screens. From 1965 to the mid-1980s it was the world's dominant source, and in 1974 the United States produced 19,900 tonnes of a world 25,600, or 78%, in USGS's long-run series.
That series shows the American share falling to 31% in 1985, and it was 38% in 1990 before giving way. The 2000 yearly sheet blames low output on "a blocked wastewater pipe". The 2001 edition reports the separation plant temporarily closed. By the 2004 table US mining is a dash for 2003, and it stays a dash through 2011; USGS's long-run series shows zero from 2001. Separation restarted on old stockpiles in October 2007.
A new owner, Molycorp, reopened the pit, and USGS later put 2012 at 3,000 tonnes, with 5,900 for 2015. Molycorp filed for bankruptcy that June, the site was idled in the fourth quarter, and the tables go back to dashes for 2016 and 2017. MP Materials bought it in 2017 and mining restarted in early 2018. In 2025 the company reported a record 50,692 tonnes of oxide in concentrate, which matches USGS's rounded 51,000 almost exactly.
Refining is where the lead really sits
USGS does not publish refining by country, and that omission matters more than any line in its table. A concentrate is not a magnet ingredient until the elements are separated. The best public measure comes from the International Energy Agency, whose rare earth report covers the four magnet elements: China had 60% of their mining in 2024, 91% of refined output and 94% of sintered permanent magnets.
USGS's own American numbers show the same bottleneck from the inside. The United States made 8,900 tonnes of compounds and metals in 2025, about 17% of what it mined, up from 120 tonnes in 2021. It is a net exporter of concentrate, yet it relied on imports for 67% of the compounds and metals it used, and 71% of imports in 2021 to 2024 came from China. Its exports of ores and compounds fell from 37,500 tonnes in 2024 to 14,000 in 2025. For terbium and holmium, the heavy rare earths sheet lists China as the source of 100% of American imports.
China tightened export controls on seven rare earths in April 2025 and widened them in October, then suspended the October measures to 10 November 2026. In September the US and China extended their truce to 10 January 2027; we found no numbered Chinese notice changing the date as of 4 November. The April controls were never suspended. The IEA estimates that full enforcement would put $6.5 trillion a year of production outside China at risk. It also reports refining concentration falling modestly between 2023 and 2025, as projects in Malaysia and the United States came on.
Why you may have read that Brazil has 21 million tonnes
Reserves are the softest number here. USGS defines them as what could be economically extracted at the time of determination, whether or not any mine is in place, so they move with geology, prices and paperwork. In one edition Vietnam went from 22 to 3.5 million tonnes.
| Country | 2023 edition | 2024 edition | 2025 edition | 2026 edition (ver. 1.3) |
|---|---|---|---|---|
| China | 44 Mt | 44 Mt | 44 Mt | 44 Mt |
| Brazil | 21 Mt | 21 Mt | 21 Mt | 11 Mt |
| Australia | 4.2 Mt | 5.7 Mt | 5.7 Mt | 6.3 Mt |
| Russia | 21 Mt | 10 Mt | 3.8 Mt | 3.8 Mt |
| Vietnam | 22 Mt | 22 Mt | 3.5 Mt | 3.5 Mt |
| India | 6.9 Mt | 6.9 Mt | 6.9 Mt | not reported |
| United States | 2.3 Mt | 1.8 Mt | 1.9 Mt | 1.9 Mt |
| World | 130 Mt | 110 Mt | over 90 Mt | over 75 Mt |
The first release of the 2026 edition said 21 million tonnes and a world total above 85 million. A correction on 27 May 2026 cut these to 11 million and above 75 million. The USGS data file still carried the old values when we downloaded it in November, so plenty of pages repeat them. Brazil stays second either way, and a Brazilian factsheet puts the change down to classification criteria and warns that the baseline figures are still fragile.
Three more caveats change the ranking. USGS gives Australia 6.3 million tonnes, but only 3.3 million meet the JORC reporting code, which would put it behind Russia and Vietnam. India had 6.9 million tonnes in the 2025 edition, enough for third, and now has no figure; the footnote cites only a 2015 report of 256,000 tonnes of monazite from one company's operations. And 58% is a share of what gets reported, not of what exists. China's own 2012 white paper put its share at about 23%, when USGS's table that year said 50%. Neither figure is an audit.
For this piece, production comes from the USGS data release and reserves from the corrected report; shares of reserves use the 75.3 million tonnes of listed national figures. The figures include the lanthanides and yttrium but exclude most scandium. Output shares use USGS's rounded 390,000-tonne world total, so they sum to just under 100%. The long US line comes from USGS Data Series 140 to 1989, the Yearbooks to 1997 and the yearly sheets since; the 1956 and 1962 US figures are withheld.
You can download the data as a CSV with every country's tonnage and the full yearly series; if you would like your own cut of the mining and reserves shares, Parity will chart it straight from that spreadsheet.
Sources
- U.S. Geological Survey, Mineral Commodity Summaries 2026, Rare Earths (ver. 1.3, May 2026): reserves; US government work, public domain
- U.S. Geological Survey, Mineral Commodity Summaries 2026 Data Release, Commodity Salient U.S. and World Statistics: production; US government work, public domain
- U.S. Geological Survey, Mineral Commodity Summaries 2026 revision history: the correction of 27 May 2026
- U.S. Geological Survey, Mineral Commodity Summaries, Rare Earths, editions 1996, 2000, 2001, 2003–2025: world tables from 1998; older editions via the Internet Archive
- U.S. Geological Survey, Data Series 140, Rare Earths Statistics (December 2012): production to 1989, via the Internet Archive
- U.S. Geological Survey, Minerals Yearbook, Rare Earths, 1994, 1996 and 1998: world mine production, 1990–97, via the Internet Archive
- U.S. Geological Survey, Minerals Yearbook, Rare Earths, 2013: revised 2010 and 2012 figures
- U.S. Geological Survey, Mineral Commodity Summaries 2026, Rare Earths (Heavy)
- Haxel, Hedrick and Orris, Rare Earth Elements: Critical Resources for High Technology, USGS Fact Sheet 087-02, 2002
- International Energy Agency, Rare Earth Elements, executive summary
- International Energy Agency, Global Critical Minerals Outlook 2026: CC BY 4.0
- State Council Information Office of China, Situation and Policies of China's Rare Earth Industry, 2012
- MP Materials, Fourth Quarter and Full Year 2025 Results, Form 8-K, 26 February 2026
- Observatório da Mineração, Rare Earths Factsheet, 2026
- World Trade Organization, DS431: China, Measures Related to the Exportation of Rare Earths, Tungsten and Molybdenum
- investingLive, China quietly issues 2025 rare earth quotas, 21 July 2025 (reporting Reuters)
- Wikipedia, Mountain Pass Rare Earth Mine: CC BY-SA 4.0
- Natural Earth country outlines (via world-atlas): public domain
For the chemistry behind the numbers, and what each element does inside a turbine or a phone, see our guide to rare earth minerals, and our look at where mineral deposits form explains why the ore gathers in so few places.