
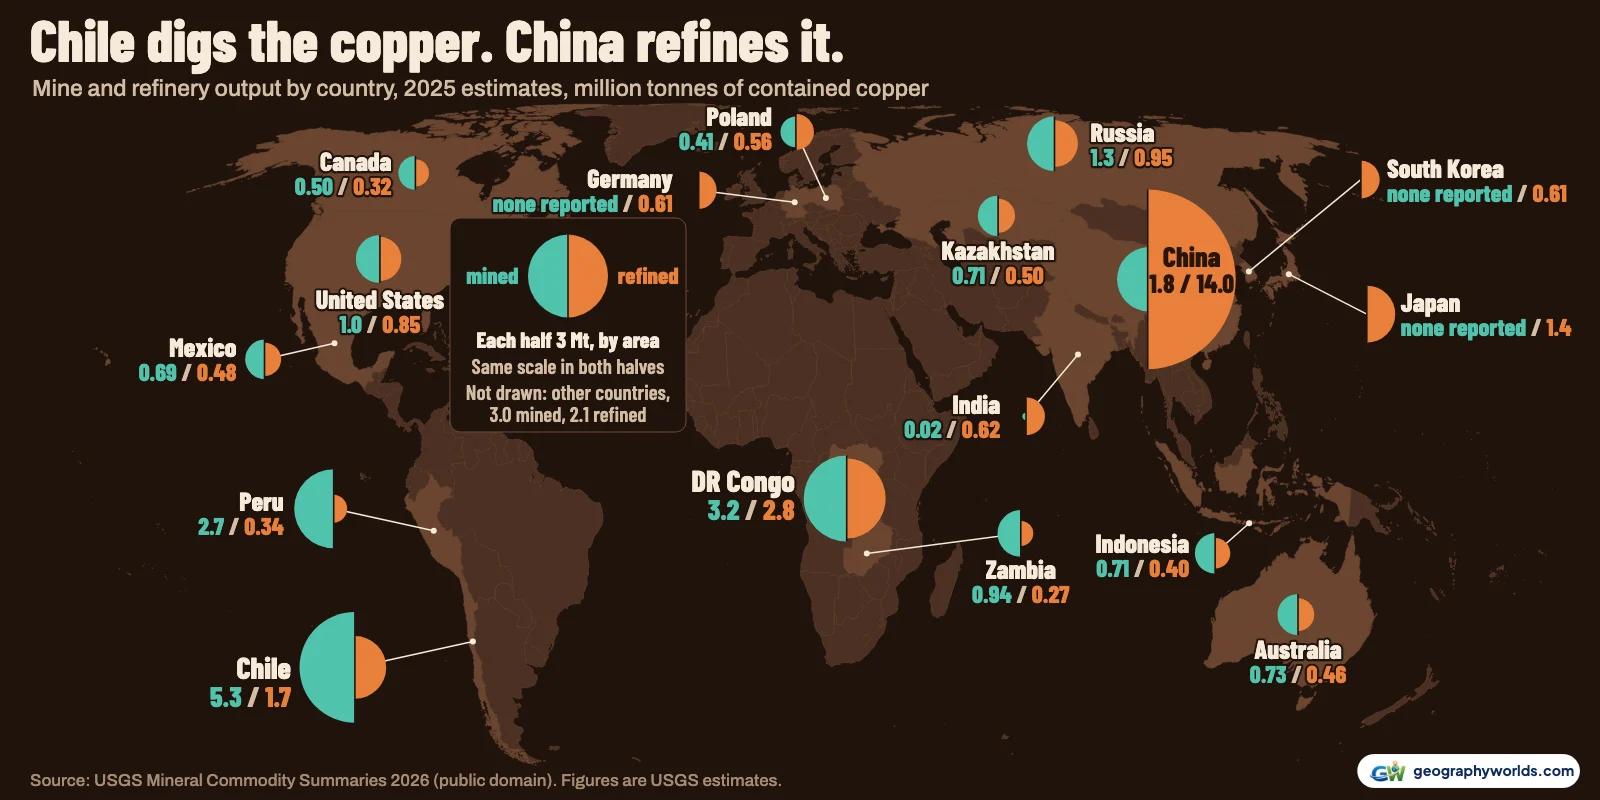
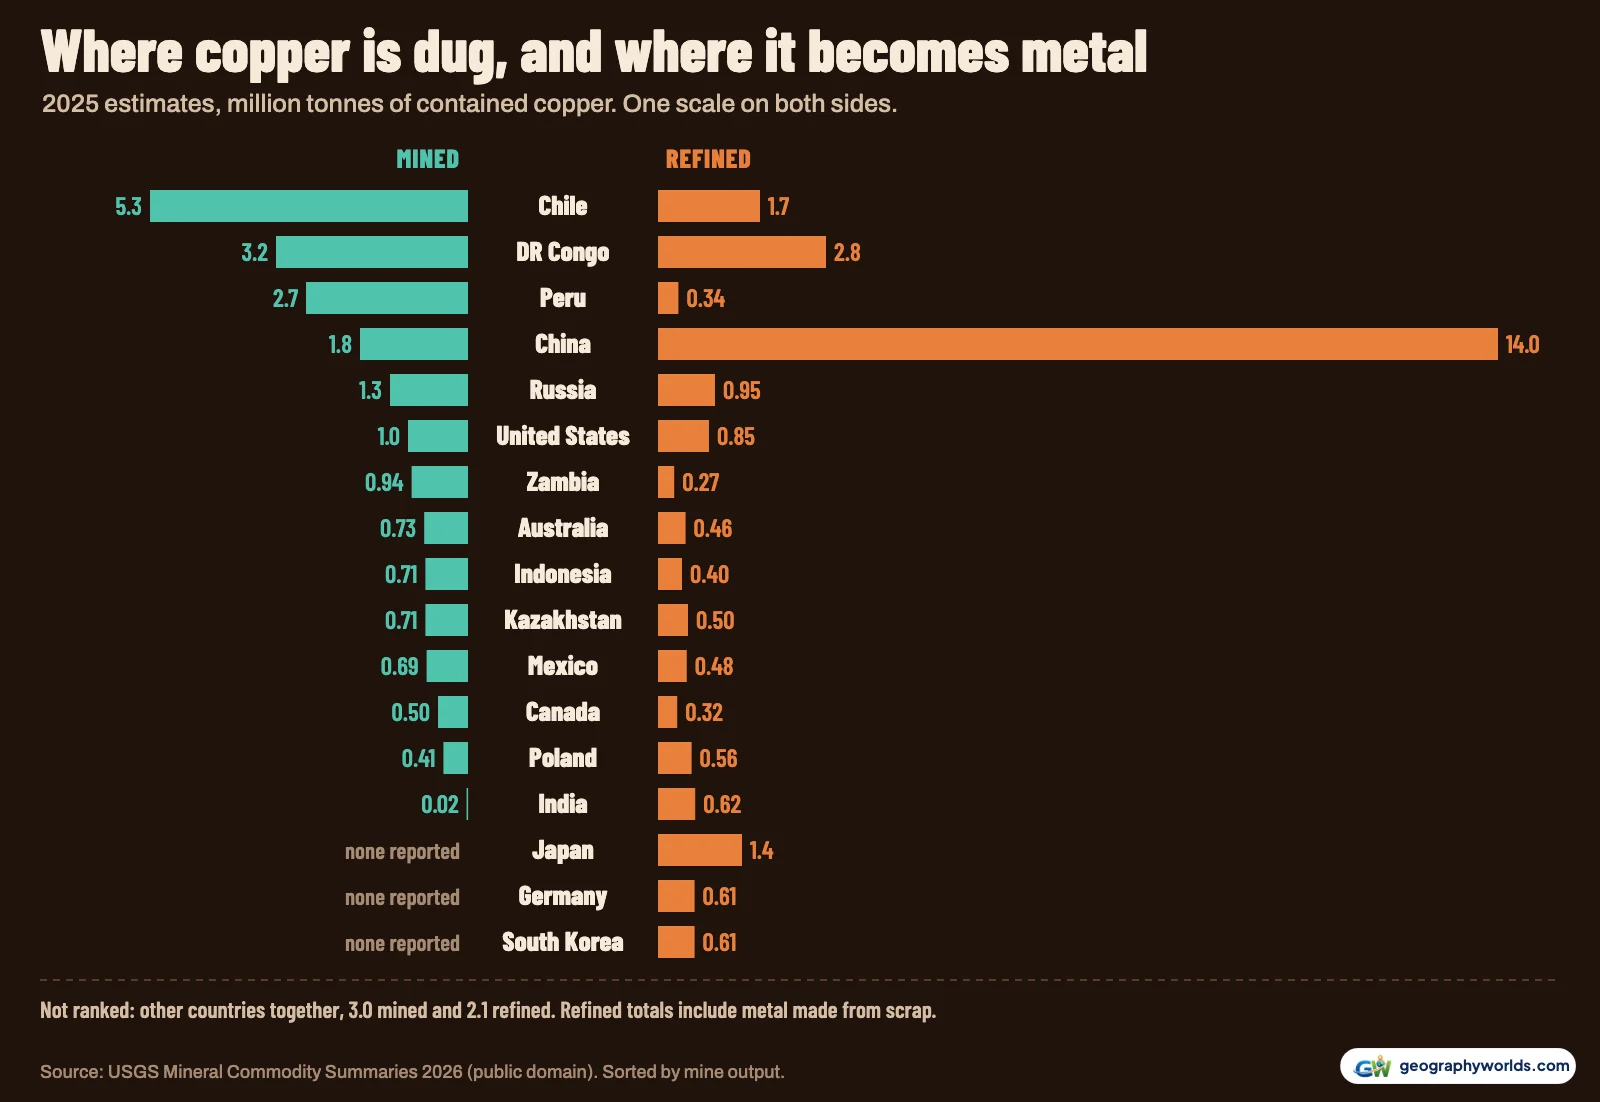
Chile mines the most copper of any country, about 5.3 million tonnes of contained copper in 2025, or 23% of the world's mine output, ahead of DR Congo (3.2 million) and Peru (2.7 million). China refines the most, about 14 million tonnes, or 48% of the world's refined copper, while ranking only fourth in mining at 1.8 million. Those 2025 figures are estimates from the U.S. Geological Survey's Mineral Commodity Summaries 2026. They answer two different questions, because copper usually leaves the country that digs it long before it becomes metal.
This article follows that ore, from an Andean pit to a smelter to a Chinese refinery, with a stop in the Central African Copperbelt, where DR Congo works differently.
Two rankings for one metal
Mine production counts copper in ore that has been dug and processed. Refinery production counts finished metal, and it includes metal made from scrap: the USGS table for the United States in 2024 reads 882 thousand tonnes from ore plus 39 thousand from scrap, 921 thousand in all. That is largely why the world's refined total, about 29 million tonnes in 2025, runs about 6 million above the mined total of about 23 million. Adding the two columns together would count much of the same copper twice, so this article keeps them apart.
Only DR Congo sits second on both lists. Chile falls from first to third, Peru from third to fifteenth, and Japan climbs from no reported mine output to fourth.
In the Atacama, ore that is about 1% copper
Chile's lead comes from a few enormous open pits and underground mines in its dry north, around the Atacama Desert. BHP's annual report calls Escondida the world's largest copper mine. In the year to June 2025 its concentrators were fed ore grading 1.02% copper, up from 0.88% the year before. At that grade, a tonne of rock holds about ten kilograms of the metal, which is why the first steps happen beside the pit. The ore is crushed, ground and floated into a concentrate, and that powder is what travels.

Chile's own commission gives a slightly higher number than the USGS: Cochilco counted 5.415 million tonnes in 2025, down 1.6% on 2024, about 2% above the USGS estimate. Either way the gap to second place is at least 2.1 million tonnes. Chile also holds the largest reserves in the USGS table, 180 million tonnes of the world's 980 million, or 18%.
Peru, further up the same mountain chain, shows the pattern at its starkest. Its ministry reports a record 2,769,794 tonnes of fine copper in 2025; the USGS estimate is 2.7 million. Refined output was just 0.34 million, about one tonne for every 8 mined and the lowest ratio of any producer in the table. Most of the rest leaves unrefined.
A ship full of powder, and a smelter paid nothing
Much of that concentrate crosses the Pacific. China imported a record 30.31 million tons of copper ores and concentrates in 2025, according to a Reuters report. Shanghai Metals Market puts 9.64 million dry tonnes from Chile and 7.42 million from Peru. Those weights are the whole concentrate, not the copper inside it, so they can't be set against the USGS columns directly.
Mine supply is the bottleneck, and smelters are fighting over feed. A smelter earns a treatment charge from the miner for processing concentrate, and that fee has collapsed. Reuters, citing two sources, reported that Antofagasta agreed 2026 charges of $0 a ton and 0 cents a pound with a Chinese smelter, against $21.25 and 2.125 cents for 2025, and that spot fees had already gone negative. World mine output grew about 1% in 2025 while refined output grew 4.2%, on preliminary figures from the International Copper Study Group. USGS's rounded totals point the same way: refined up 5.1%, mined flat.
Chile itself is refining less. USGS shows its refinery output at 2.33 million tonnes in 2020, 1.94 million in 2024 and an estimated 1.7 million in 2025, down 27% in five years. Codelco shut its Ventanas smelter on 31 May 2023 after decades of pollution in Quintero Bay, although the refinery beside it kept running. Its refined output now equals about 32% of its mined tonnage.
China: 14 million tonnes from 1.8 million mined
The far end of the line turns the picture upside down. China's refineries made about 7.8 tonnes of copper for every tonne its mines produced, a ratio beaten only by India, which barely mines at all. Refined output has risen 40% since the 10 million USGS listed for 2020, and China accounts for about 58% of world refined copper use, according to the ICSG figures. Its mines cover only a fraction of that, so the rest of the feed comes from imported concentrate and scrap.
China's own count runs higher than the USGS estimate. The National Bureau of Statistics and the industry association put 2025 output at 14.72 million tonnes, about 5% above the USGS figure, while a Mysteel survey ran below the official series through November. The sources count differently. China stays first by a very wide margin on either count, and this article uses the USGS figure so that every country comes from the same table.
DR Congo refines at home on the Central African Copperbelt
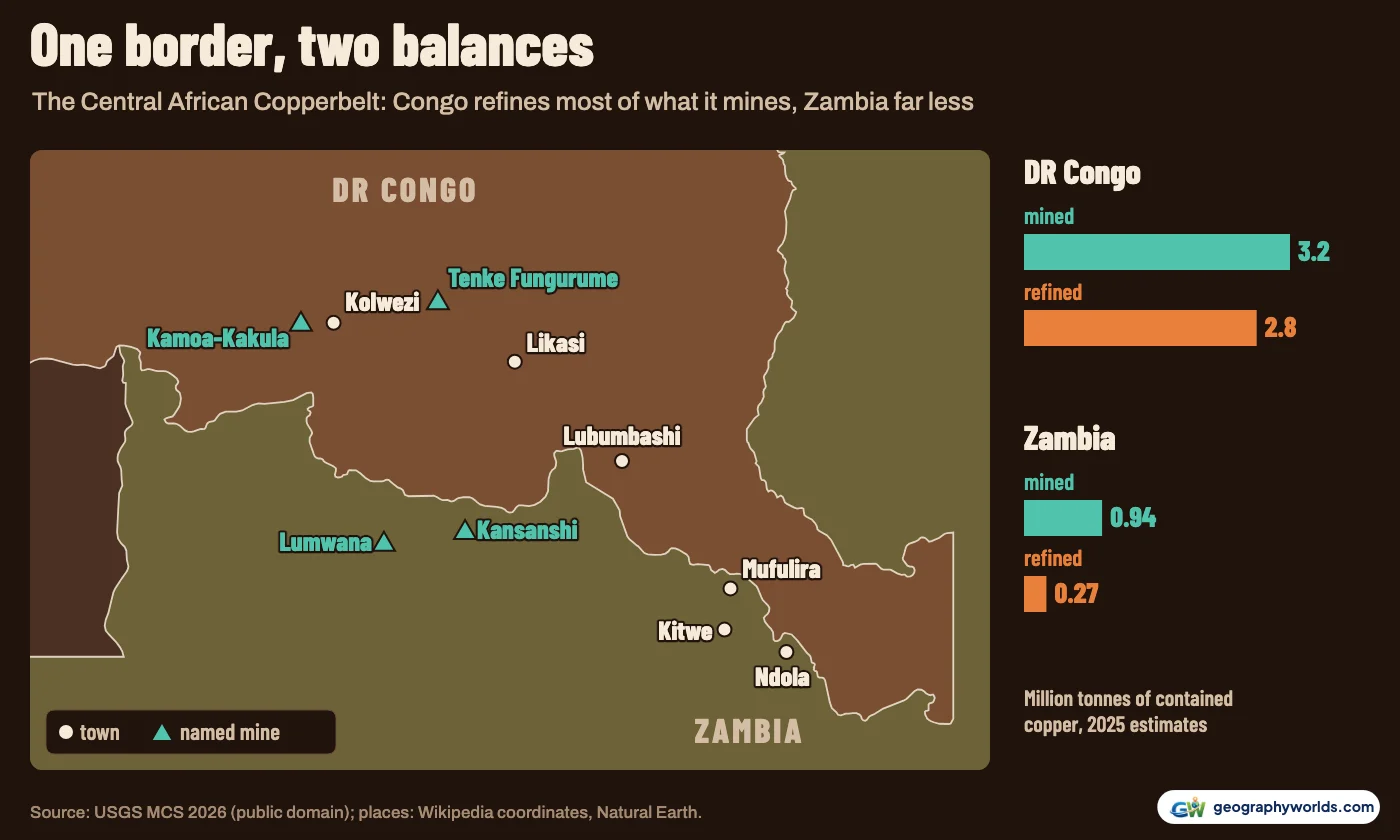
Copper's supply chain has one big exception, DR Congo. It and Zambia share a mining district that straddles their border, with Kolwezi and Ndola about 430 km apart in a straight line. Its stratiform copper and cobalt deposits lie in the rocks of the Katanga Supergroup, and it was the largest copper-producing area in the world in the 1950s. Together the two countries mined about 4.14 million tonnes in 2025, 18% of the world total, and Congo alone mines 74% of the world's cobalt on USGS's estimate, the subject of our guide to cobalt mining.
DR Congo has added more mine output than any other country since 2010. USGS listed it at 0.34 million tonnes that year, twelfth of the 13 producers it named. In 2025 it stands at about 3.2 million, roughly 9 times as much, and only Chile is ahead.
What sets Congo apart is how much it finishes at home: refined output equals about 88% of its mined tonnage, and at 2.8 million tonnes it tops Chile's. The USGS 2022 yearbook for the country says 77% of its copper that year was refined before export and another 6% smelted, and it names several mines with solvent extraction-electrowinning (SX-EW) plants, which make copper cathode at the mine without a smelter. The same report notes a 2021 decree banning copper concentrate exports, with waivers. New capacity keeps arriving: Ivanhoe's Kamoa-Kakula complex, about 25 km west of Kolwezi, produced its first anodes on 29 December 2025 from a 500,000-tonne-a-year smelter.
Across the border the balance is very different. Zambia's refinery output is an estimated 0.27 million tonnes against 0.94 million mined, about 29%. Sources also differ on the mined figure: Zambia's mines ministry reported 890,346 tonnes for 2025, about 50 thousand below the USGS estimate, though the two agree closely on 2024. Zambia ranks seventh on either number. For Congo, a ministry count of 3.10 million tonnes exported in 2024 sits close to the USGS's 2.99 million mined that year, but the two part ways in 2025: exports fell 17.3% in the first nine months while USGS estimates mine output rose 7% over the full year. Between them, China and Congo now make 58% of the world's refined copper on USGS figures, and about 57% on the ICSG's count.
Refiners with no mines, and a mine that stopped
Three countries in the refined column have no mine output in the USGS table at all. Japan made about 1.4 million tonnes in 2025, fourth in the world, with Germany and South Korea at 0.61 million each. Together that is 2.62 million tonnes built on imported feed and scrap. India nearly joins them: 23 thousand tonnes mined against 0.62 million refined.
Supply can also vanish quickly at the other end. Indonesia's mine output fell from 1.01 million tonnes to an estimated 0.71 million, down 30% in one year. Part of the reason: in September 2025 about 800,000 tonnes of wet material surged into the Grasberg Block Cave, a fatal accident that led Freeport to declare force majeure on deliveries.
Every country in the USGS table
| Country | Mined, Mt | Share | Refined, Mt | Share | Refined ÷ mined |
|---|---|---|---|---|---|
| Chile | 5.3 | 23.0% | 1.7 | 5.9% | 0.32 |
| DR Congo | 3.2 | 13.9% | 2.8 | 9.7% | 0.88 |
| Peru | 2.7 | 11.7% | 0.34 | 1.2% | 0.13 |
| China | 1.8 | 7.8% | 14.0 | 48.3% | 7.78 |
| Russia | 1.3 | 5.7% | 0.95 | 3.3% | 0.73 |
| United States | 1.0 | 4.3% | 0.85 | 2.9% | 0.85 |
| Zambia | 0.94 | 4.1% | 0.27 | 0.9% | 0.29 |
| Australia | 0.73 | 3.2% | 0.46 | 1.6% | 0.63 |
| Indonesia | 0.71 | 3.1% | 0.40 | 1.4% | 0.56 |
| Kazakhstan | 0.71 | 3.1% | 0.50 | 1.7% | 0.70 |
| Mexico | 0.69 | 3.0% | 0.48 | 1.7% | 0.70 |
| Canada | 0.50 | 2.2% | 0.32 | 1.1% | 0.64 |
| Poland | 0.41 | 1.8% | 0.56 | 1.9% | 1.37 |
| India | 0.02 | 0.1% | 0.62 | 2.1% | 26.96 |
| Japan | none reported | – | 1.4 | 4.8% | – |
| Germany | none reported | – | 0.61 | 2.1% | – |
| South Korea | none reported | – | 0.61 | 2.1% | – |
| Other countries | 3.0 | 13.0% | 2.1 | 7.2% | – |
| World (USGS, rounded) | 23.0 | 29.0 |
The table holds the 17 countries USGS names; "other countries" is a remainder, so it is not ranked. Figures are contained copper in metric tons, rounded by USGS, and all of them are 2025 estimates. Near-ties, such as Indonesia and Kazakhstan on mine output, should not be read too finely. History comes from earlier editions as first published, and later editions may revise those numbers.
You can download the data as a CSV with 2024 and 2025 figures, ranks, shares and reserves for each country. To line the two columns up your own way, load it into Parity and chart whichever pair you like.
- U.S. Geological Survey, Mineral Commodity Summaries 2026: Copper, and the MCS 2026 data release: 2024 and estimated 2025 mine and refinery production and reserves by country, thousand metric tons of contained copper; the report is a US government work, the data release is marked CC0 1.0
- U.S. Geological Survey, Mineral Commodity Summaries 2012, 2017 and 2022: Copper: 2010, 2015 and 2020 figures as published in those editions; public domain
- U.S. Geological Survey, 2022 Minerals Yearbook: Congo (Kinshasa): share of Congolese copper refined or smelted before export; public domain
- Wikipedia article coordinates (via the MediaWiki API): town and mine positions on the Copperbelt map; CC BY-SA 4.0
- Natural Earth country outlines (via world-atlas): public domain
For how the Andes' porphyry deposits form and how the ore is mined, carry on with our geographic guide to copper mining.