
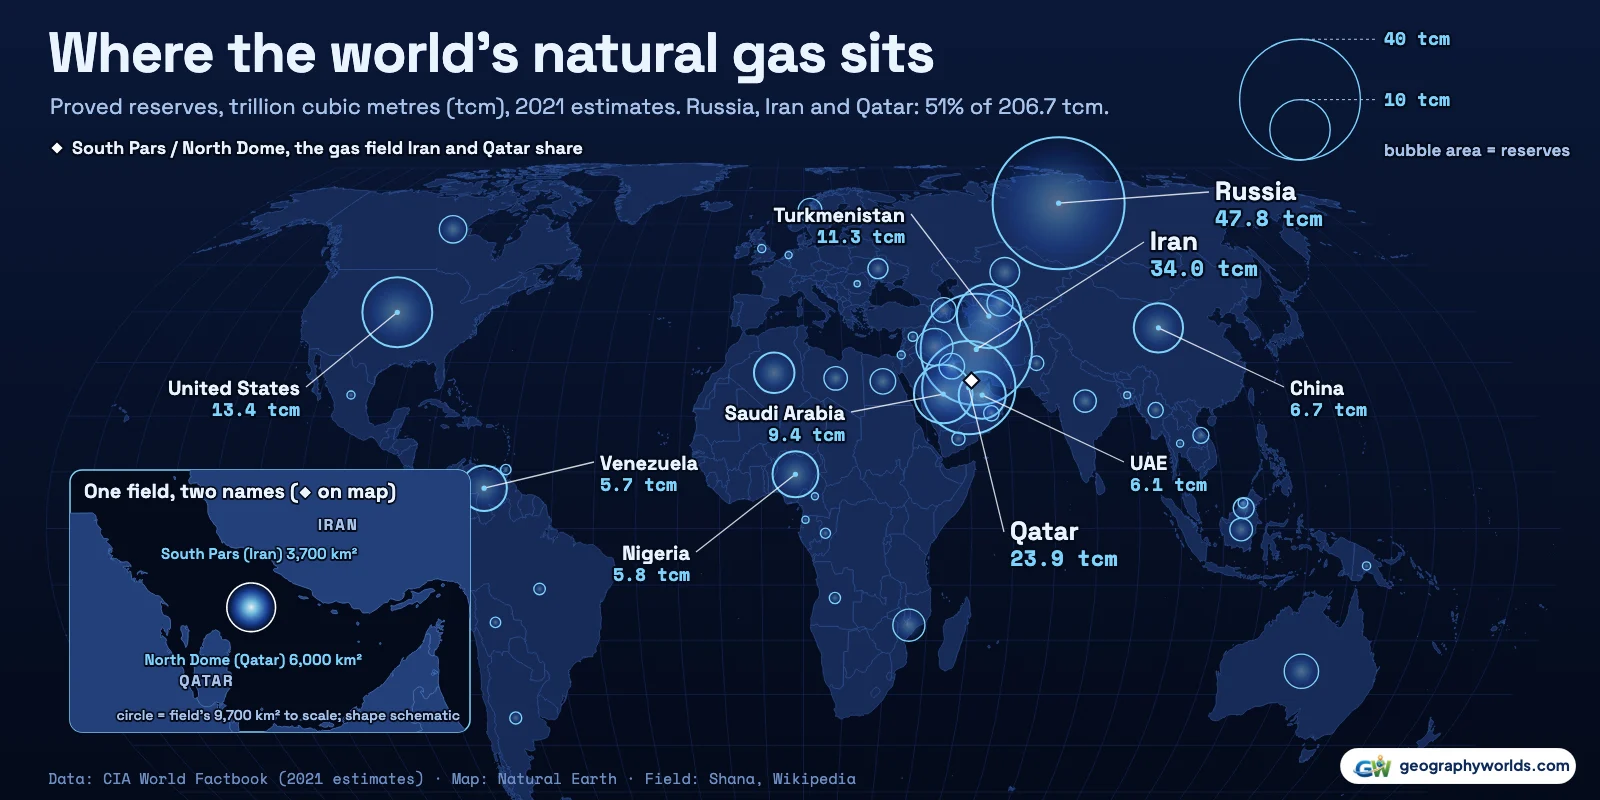
Russia has the most natural gas of any country: 47.8 trillion cubic metres (tcm) of proved reserves, or 1,688 trillion cubic feet (tcf), which is 23% of the world's 206.7 tcm in the CIA World Factbook's estimates, all dated 2021. Iran comes second with 34.0 tcm and Qatar third with 23.9 tcm, and those three alone hold 51% of the world's proved gas. The United States (13.4 tcm) and Turkmenistan (11.3 tcm) complete the top five. Production is a different ranking: the United States extracted the most gas in 2024, 1,069 billion cubic metres (bcm) of dry gas, 25% of world output, ahead of Russia (642 bcm) and Iran (279 bcm), according to the US Energy Information Administration (EIA).
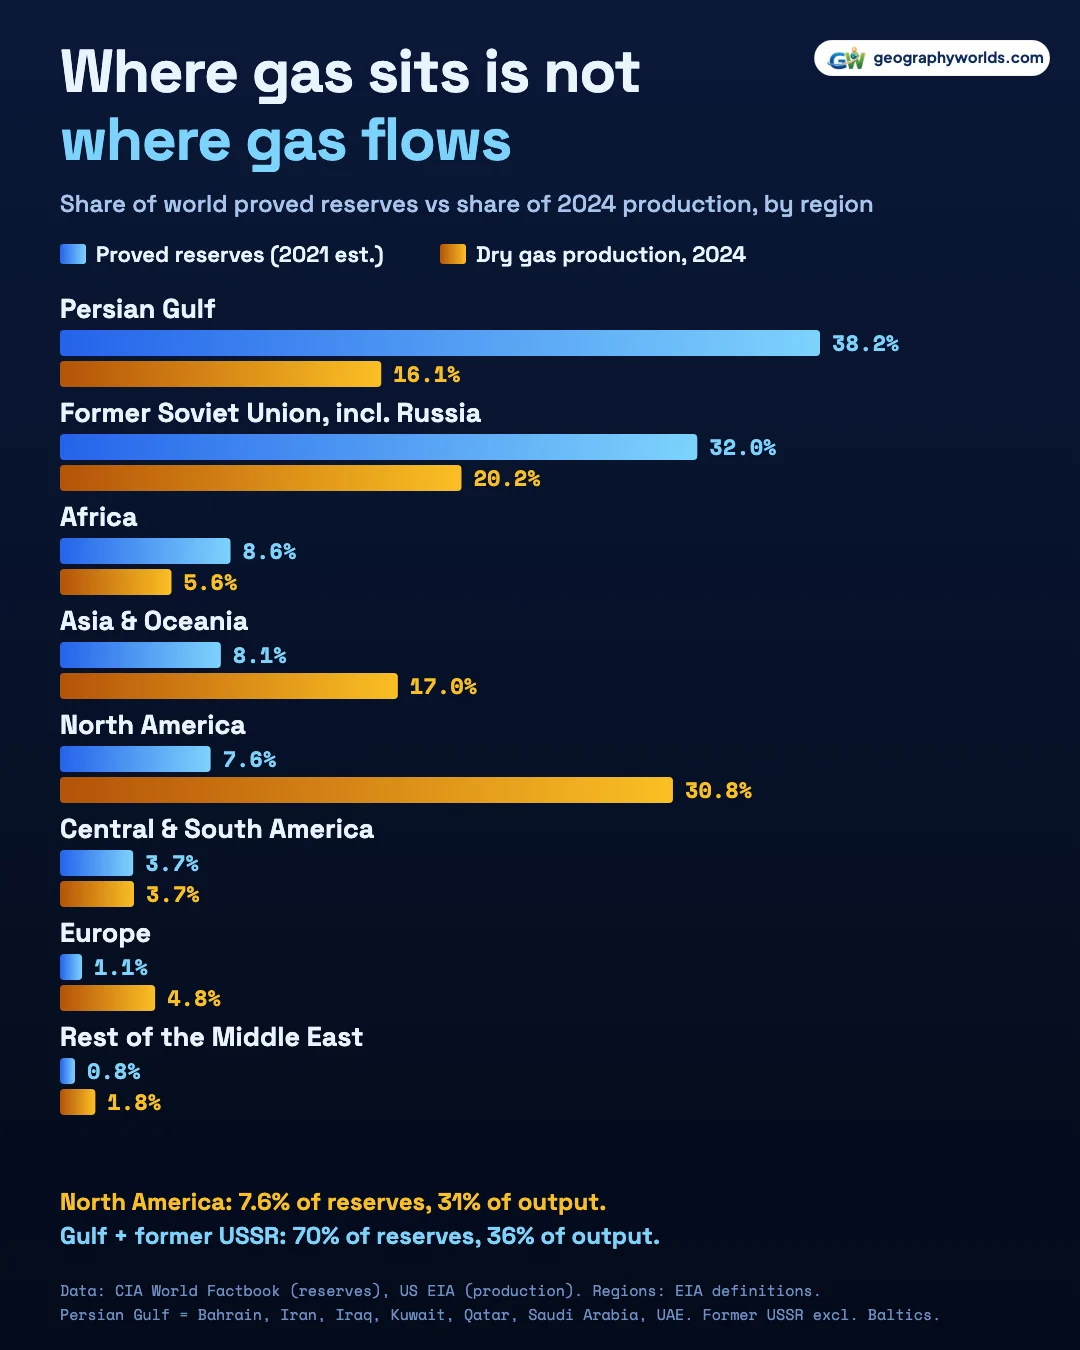
Put those reserves on a map and they gather in two places. The countries around the Persian Gulf and the countries of the former Soviet Union hold 70% of the world's proved natural gas between them, yet in 2024 they produced only 36% of it. North America is the mirror image: 7.6% of the reserves, 31% of the output.
The Persian Gulf: 79.0 tcm around one shallow sea
The EIA groups seven countries on the Persian Gulf: Iran, Qatar, Saudi Arabia, the United Arab Emirates, Iraq, Kuwait and Bahrain. Together they hold 79.0 tcm, 38% of all proved gas, more than any other region. Iran's 34.0 tcm and Qatar's 23.9 tcm make up most of it, Saudi Arabia adds 9.4 tcm, the UAE 6.1 tcm (8.2 tcm by the GECF's end-2024 count), Iraq 3.7 tcm and Kuwait 1.8 tcm.
A large part of the Iranian and Qatari gas sits in a single reservoir. Iran calls it South Pars, Qatar calls it the North Dome or North Field, and it straddles the maritime boundary between them. Shana, the Iranian oil ministry's news agency, gives its extent as 9,700 square kilometres, of which 3,700 km² lie in Iranian waters and 6,000 km² in Qatari waters, so 62% of the field's area is on Qatar's side. The field's reservoir lies about 3,000 metres below a seabed covered by only around 65 metres of water, and the Qatari part was found first, by a Shell well in 1971. On the hero map it is the white diamond in the middle of the Gulf.

Qatar's number is the most contested in the Gulf. The proved figure of 23.9 tcm (843 tcf) is closely matched by OAPEC and by the Gas Exporting Countries Forum (GECF), which put Qatar at 23.8 tcm at the end of 2024. In February 2024, however, QatarEnergy's chief Saad al-Kaabi announced that appraisal drilling had found the field extending further west and that Qatar's gas reserves had risen "from 1,760 to more than 2,000 trillion cubic feet", as Al Jazeera reported. That is well over twice the proved figure. The two numbers measure different things: proved reserves count only gas shown to be commercially recoverable from known reservoirs at current conditions, while the company's figure is a broader estimate of what the field holds. We rank on the proved figure.
The Gulf produces far less than it holds. Its countries extracted 681 bcm of dry gas in 2024, 16% of the world total. Iran was the third-largest producer at 279 bcm, Qatar sixth at 170 bcm and Saudi Arabia produced 123 bcm. At 2024 rates, Qatar's end-2024 reserves would last about 140 years and Iran's 122. Iraq is the extreme case: 3.7 tcm of proved gas but only 10 bcm of dry gas output in 2024, enough reserves for about 360 years at that pace.
The former Soviet Union: 66.2 tcm, and a contested number in Turkmenistan
The second great pool lies across the former Soviet Union, which holds 66.2 tcm, 32% of world reserves. Russia's 47.8 tcm is 72% of that. The GECF's newer figure for the end of 2024 is slightly lower, 46.8 tcm, but on any count Russia's reserves are larger than Iran's and Qatar's. Russia produced 642 bcm of dry gas in 2024, the second most in the world, and at that rate its end-2024 reserves would last about 73 years.

The rest of the region's gas sits around and east of the Caspian Sea: Turkmenistan 11.3 tcm, Kazakhstan 2.4 tcm, Uzbekistan 1.8 tcm and Azerbaijan 1.7 tcm. Turkmenistan's figure is the hardest to pin down. The consultancy GaffneyCline has audited its giant Galkynysh field, with growing results. In 2013 the Moscow Times reported its estimate for Galkynysh alone at 13.1 to 21.2 tcm. In December 2022 Turkmenistan's oil and gas portal gave 27.4 tcm for Galkynysh together with the neighbouring Yashlar and Garakol fields. The 2022 figure, and the top of the 2013 range, would put Turkmenistan above the United States. But they describe gas in a few fields, not the country's proved reserves, so we keep the 11.3 tcm figure and flag the gap rather than rank on the larger one.
Turkmenistan produced 78 bcm in 2024, down from 84 bcm in 2023, which puts it 12th among producers. The former Soviet Union as a whole produced 851 bcm, 20% of world output, most of it Russian.
North America: 7.6% of the gas, 31% of the output
Cross the Atlantic and the picture inverts. The United States, Canada and Mexico hold 15.6 tcm between them, but in 2024 they produced 1,300 bcm, more than any other region. The United States alone produced 1,069 bcm (37.8 tcf), more than Russia and Iran combined. Canada was the fifth-largest producer with 199 bcm from 2.1 tcm of reserves, and Mexico produced 31 bcm from 0.18 tcm.
The American reserve figure moves quickly, and the Factbook's 13.4 tcm is an old estimate. The EIA's own count, published in April 2026, puts US proved reserves at 583.9 tcf at the end of 2024, down 3% from 603.6 tcf a year earlier; in dry gas, the measure used everywhere else in this article, that is 545.4 tcf, or 15.4 tcm. Shale plays account for 65% of US gas reserves, the EIA says. The catch is how long that lasts: at the 2024 production rate, US reserves would last about 14 years, against well over a century for Qatar and Iran.
The rest of the map: Africa, Asia, Latin America and Europe
Africa holds 8.6% of world reserves, led by Nigeria (5.8 tcm), Algeria (4.5 tcm), Mozambique (2.8 tcm) and Egypt (1.8 tcm), but produced 5.6% of the world's gas in 2024. Nigeria's 5.8 tcm supported only 39 bcm of dry gas output.
Asia and Oceania run the other way. The region holds 8.1% of reserves and produced 17% of the world's gas. China, with 6.7 tcm, was the fourth-largest producer at 258 bcm, and Australia produced 152 bcm from 3.2 tcm. Central and South America hold 3.7% of reserves, most of it Venezuela's 5.7 tcm. Europe has only 1.1%, with Norway's 1.5 tcm the largest share, yet Norway produced 131 bcm in 2024 and Europe as a whole 4.8% of world output. The Middle East outside the Gulf states adds 0.8%.
All twenty, with the newest figures beside them
The table ranks the 20 largest reserve holders on the Factbook's 2021 estimates, covering about 100 countries on one basis, with the newest figure we could find beside each: the GECF bulletin for its members and observers, OAPEC's report for Saudi Arabia and Kuwait, and the EIA's own report for the United States. Some Factbook figures are older than their 2021 label: the UAE's 6.1 tcm is the GECF's figure for 2015 to 2018, and Qatar's 23.9 tcm its figure for 2017. Egypt and Kuwait are tied at 1.8 tcm. For most countries the two agree closely. The two that moved most both moved up: the United Arab Emirates, which the GECF puts at 8.2 tcm, and the United States.
| # | Country | Reserves, tcm (2021 est.) | Same, tcf | World share | Newest figure, tcm (end 2024) | Dry gas output 2024, bcm | Output rank |
|---|---|---|---|---|---|---|---|
| 1 | Russia | 47.80 | 1,688 | 23.1% | 46.8 (GECF) | 642 | 2 |
| 2 | Iran | 33.99 | 1,200 | 16.4% | 34.0 (GECF) | 279 | 3 |
| 3 | Qatar | 23.86 | 843 | 11.5% | 23.8 (GECF) | 170 | 6 |
| 4 | United States | 13.40 | 473 | 6.5% | 15.4 (EIA) | 1,069 | 1 |
| 5 | Turkmenistan | 11.33 | 400 | 5.5% | – | 78 | 12 |
| 6 | Saudi Arabia | 9.42 | 333 | 4.6% | 9.7 (OAPEC) | 123 | 9 |
| 7 | China | 6.65 | 235 | 3.2% | – | 258 | 4 |
| 8 | United Arab Emirates | 6.09 | 215 | 2.9% | 8.2 (GECF) | 59 | 14 |
| 9 | Nigeria | 5.76 | 203 | 2.8% | 6.0 (GECF) | 39 | 19 |
| 10 | Venezuela | 5.67 | 200 | 2.7% | 5.5 (GECF) | 25 | 27 |
| 11 | Algeria | 4.50 | 159 | 2.2% | 4.5 (GECF) | 99 | 10 |
| 12 | Iraq | 3.73 | 132 | 1.8% | 3.7 (GECF) | 10 | 42 |
| 13 | Australia | 3.23 | 114 | 1.6% | – | 152 | 7 |
| 14 | Mozambique | 2.83 | 100 | 1.4% | 2.8 (GECF) | 12 | 37 |
| 15 | Kazakhstan | 2.41 | 85 | 1.2% | – | 29 | 24 |
| 16 | Canada | 2.07 | 73 | 1.0% | – | 199 | 5 |
| 17 | Uzbekistan | 1.84 | 65 | 0.9% | – | 46 | 17 |
| 18= | Egypt | 1.78 | 63 | 0.9% | 1.8 (GECF) | 47 | 15 |
| 18= | Kuwait | 1.78 | 63 | 0.9% | 1.8 (OAPEC) | 20 | 32 |
| 20 | Azerbaijan | 1.70 | 60 | 0.8% | 2.6 (GECF) | 38 | 20 |
Cubic metres, cubic feet, and which year each number is
Gas is counted in two units. Most of the world, including the Factbook, the GECF and OAPEC, uses cubic metres; the United States uses cubic feet. One cubic metre is 35.3147 cubic feet, so 1 tcm is about 35.3 tcf. The EIA's production series in both units match that factor exactly. All volumes here are dry gas, the methane-rich gas left after liquids are removed; the EIA's wet US figure of 583.9 tcf is larger for that reason.
The years matter as much as the units. Every reserve figure in the Factbook is labelled a 2021 estimate, while the production numbers are for calendar year 2024, from EIA series last updated on 27 January 2026. Reserve totals also differ by publisher: the Factbook's world total is 206.7 tcm, the GECF's for the end of 2024 is 208.5 tcm and OAPEC's 211.2 tcm. On the GECF's newer numbers, Russia, Iran and Qatar hold 50% of the total, so the top of the ranking holds whichever total you use.
Bubbles on the hero map sit at the centre of each country's largest landmass, not on individual fields, and their area is proportional to reserves. Regions follow the EIA's groupings; its Persian Gulf group excludes Oman. You can download the data as a CSV with all 99 countries' reserves in both units, their regions and their 2024 production; if you'd like to plot reserves against output yourself, the file loads straight into Parity, which builds charts from spreadsheets. The GECF and OAPEC figures are quoted above but not included in the file.
- CIA World Factbook, field listing 'Natural gas' (archived 10 April 2025): Proven reserves for 99 countries plus a world total, all given as 2021 estimates in cubic metres of dry gas. Public domain US government work.
- US Energy Information Administration (2026), International Energy Statistics, bulk file INTL.zip: Dry natural gas production by country, 2024, in billion cubic metres and cubic feet; series last updated 27 January 2026. Public domain (EIA: 'U.S. government publications are in the public domain').
- US Energy Information Administration (7 April 2026), U.S. Crude Oil and Natural Gas Proved Reserves, Year-end 2024, Table 11: US proved reserves at year-end 2024, wet after lease separation and dry. Public domain.
- Gas Exporting Countries Forum (December 2025), Annual Statistical Bulletin 2025, Table 3.1.2: Proved reserves of GECF member and observer countries and the world, end of 2015–2024. Quoted for comparison; not redistributed in the CSV.
- OAPEC (2025), Annual Statistical Report 2025, Table 4: Proved gas reserves of Arab OAPEC members and the world, end of 2020–2024. Quoted for comparison; not redistributed in the CSV.
- Natural Earth admin-0 countries via the world-atlas package: Public domain. Land outlines for the map.
Many of the same Gulf and Caspian states appear on the crude oil map too, and our ranking of the countries with the most oil reserves shows where they line up and where they part ways.