
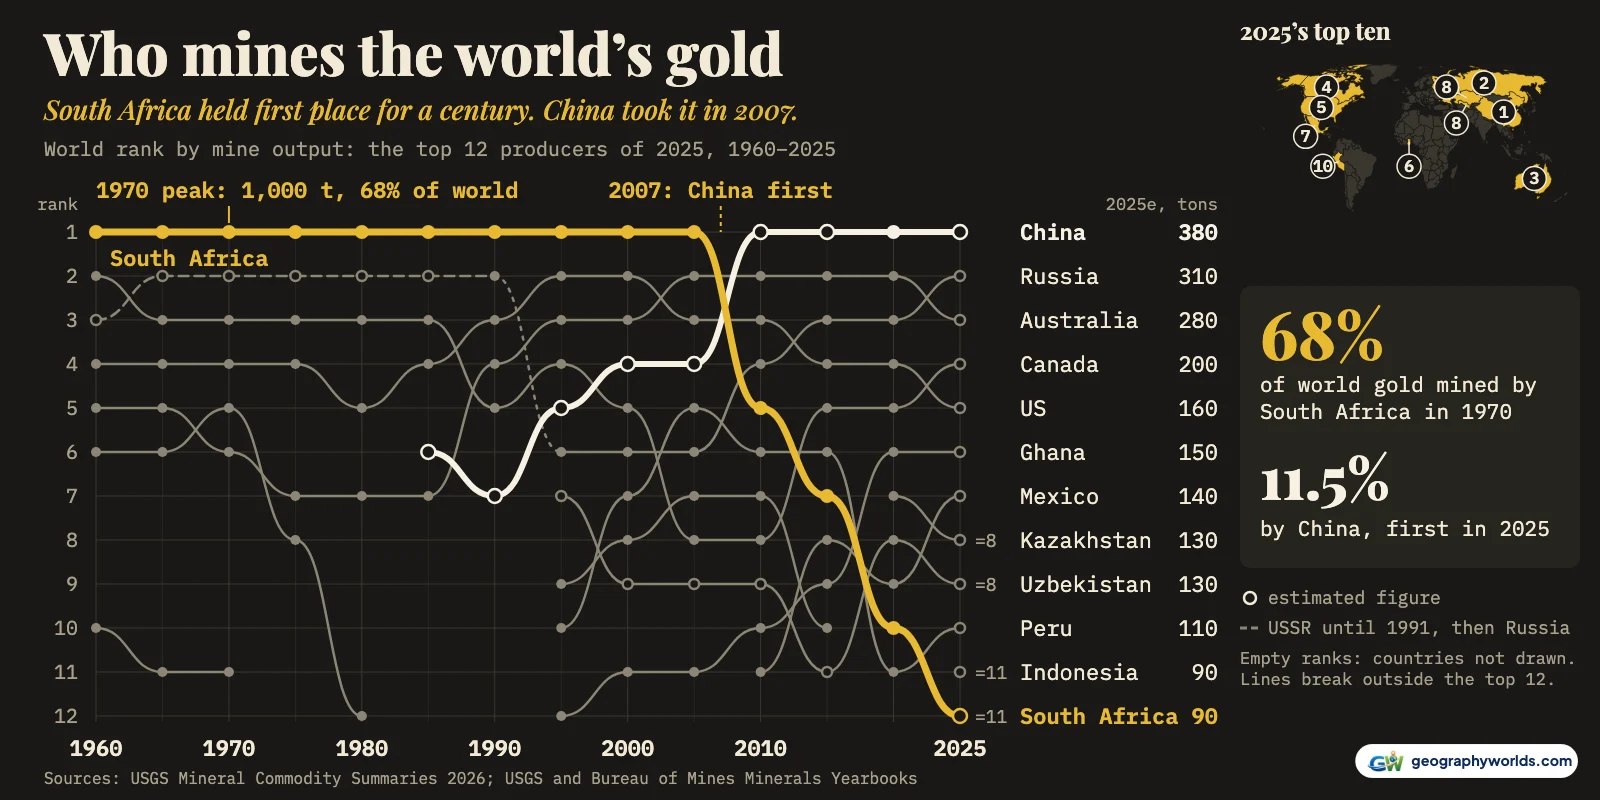
China produces the most gold: an estimated 380 metric tons in 2025, or 11.5% of the world's 3,300 tons of mine output, according to the U.S. Geological Survey (USGS). Russia is second with about 310 tons, then Australia (280), Canada (200) and the United States (160). Every 2025 figure here is a rounded USGS estimate. Together those five mined about 40% (USGS, working from unrounded figures, says 41%) of the world's new gold, which is why this ranking looks nothing like the one your grandparents knew: in 1970, South Africa alone mined 68%.
This post counts gold dug from the ground each year. Gold already sitting in vaults is another list, covered in our guide to the countries with the most gold reserves, where the United States leads. Since the Mint's 1903 table, first place has changed hands twice: from Australasia to Africa, then to China. The early rows are regions, not countries: the Transvaal alone, at about 118 tons in 1904, was still behind the United States. South Africa's run from 1905 to 2006 rests on industry accounts as well as our tables, which skip 1906-54.
1905: Australasia gives way to the Witwatersrand
The oldest country-by-country tables we used are in the 1906 report of the Director of the US Mint, which groups some producers by continent. In 1903 Australasia led with 134 tons, ahead of the United States (111) and Africa (102). In 1904 Africa moved into second, at 129 tons to Australasia's 132. In 1905 it went clear: 171 tons, against 133 for the United States and 129 for Australasia.
Nearly all of that African gold came from one place. The same report's South African section breaks down the raw gold exported through the Cape Colony in 1905: about 5.3 million troy ounces from the Transvaal, home of the Witwatersrand goldfields around Johannesburg, and 0.3 million from Rhodesia.
South Africa alone: more than half the world's gold
What followed was less a contest than a procession. By 1955 South Africa was mining 454 tons, more than three times Canada's 142, and in 1960 it reached 665 tons, 56% of the world total in the Bureau of Mines yearbook. Canada (144 tons) was second that year, the Soviet Union (128) third and the United States (52) fourth.
The Soviet figure needs a warning. The yearbooks could only estimate it, and those estimates moved a lot: the 1960 edition put Soviet output that year at 11 million troy ounces, while the 1964 edition had cut it to 4.1 million. That is why our chart starts at 1960, using the revised number, rather than earlier. From 1965 the Soviet Union sits second on the yearbooks' estimates, a position nobody could verify.
The peak came in 1970. The Bureau of Mines called it a record: 32.2 million troy ounces, or 1,000 metric tons, out of a world total of 1,478 tons. Nearly all of it came from 47 deep underground mines. No country has come close since: China's best year was less than half that. South African gold mines still fill most of the list of the deepest mines in the world, which shows how far down that output had to be chased.
A long slide from the 1970 peak
South Africa's fall was gradual enough to go unnoticed for a long time, because it stayed first throughout. It mined 671 tons in 1985 and 605 in 1990, still 28% of the world. The 1989 yearbook was already describing "escalating production costs" and "steadily declining ore grades" in a country that continued to dominate. By 2000 the figure was 431 tons, and by 2005 295.
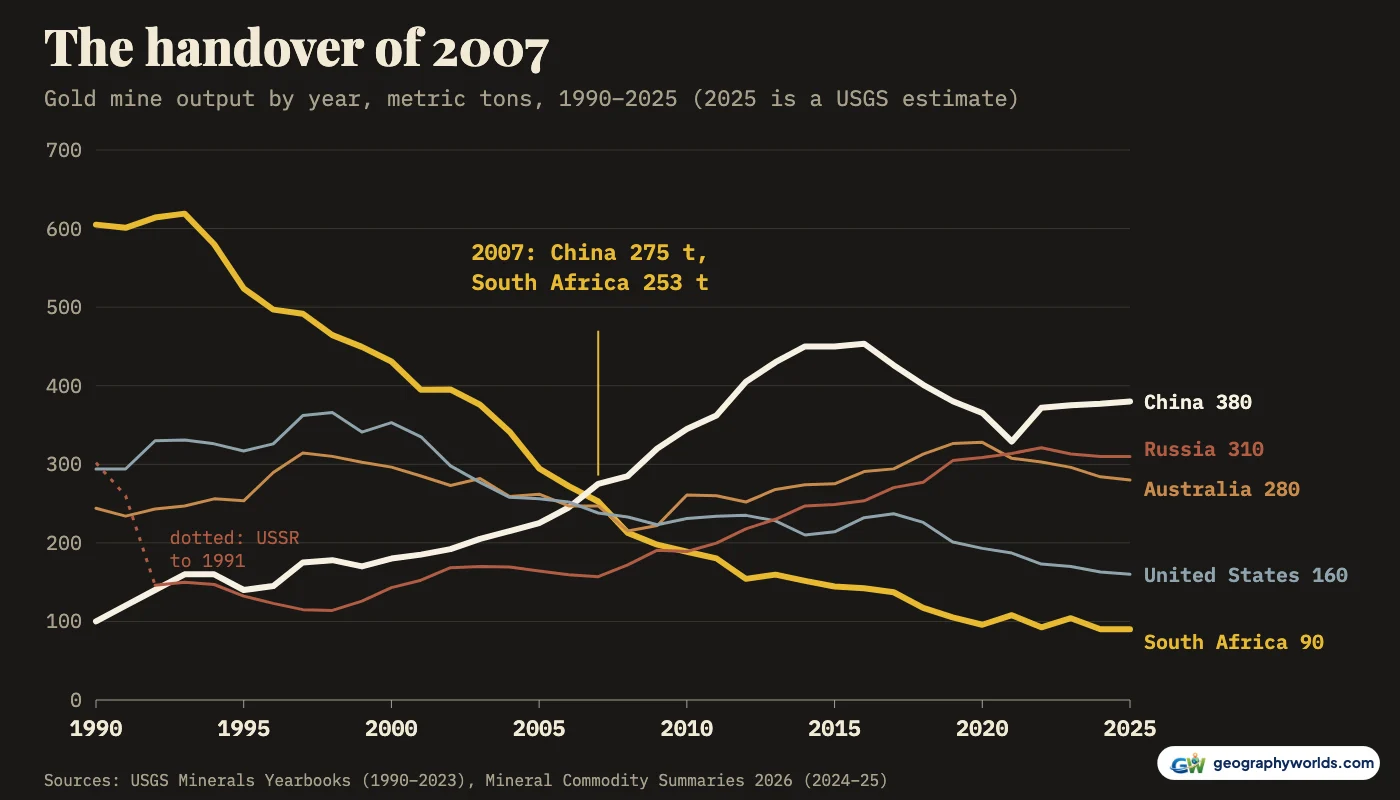
Second place, meanwhile, became a real race. When the Soviet Union dissolved in 1991, its gold split between Russia (132 tons in 1995) and new producers such as Uzbekistan (65). The United States took over as runner-up in every year from 1991 to 2002, hitting its own record of 366 tons in 1998. Australia passed it in 2003. In 2006 South Africa's lead was almost gone: 272 tons, against 252 for the United States, 247 for Australia and 245 for China.
2007: China takes first place
China mined 275 tons in 2007 and South Africa 253, on the figures USGS has settled on, and China has led in every year since. Early reports the following January had the race much closer, at 276 tons to 272, but they named the same winner.
China's early numbers deserve the same caution as Moscow's. The yearbooks list its output as an estimate for decades, and the 1984 edition jumps from 225,000 ounces in 1980 to 1.7 million in 1981 within a single table. Real mining does not grow sevenfold in a year, so that step almost certainly reflects a better estimate, and China's true rank before the 1980s is uncertain. By 1990 USGS had it at 100 tons.
Its lead widened fast. Output hit 453.5 tons in 2016, then fell for five years. The sharpest drop came in 2021, to 329 tons from 365, which USGS's yearbook ties to safety stoppages in Shandong Province after an explosion and a fire at gold mines there. Output recovered to 372 tons the following year, but it has not returned to the old high. That stumble brought China's narrowest lead since it took first place: Australia hit 328 tons in 2020, its highest in these tables, and in 2021 Russia came within about 15 tons of China. On USGS's estimates China's margin in 2025 is back to about 70 tons.

The 2025 table, and what sits outside it
South Africa now mines about 90 tons, 91% below its peak and 2.7% of world output, tied with Indonesia for eleventh among the thirteen countries USGS names. The other movers are just as striking. Ghana went from 9.3 tons in 1985 to about 150 and is sixth, ahead of Mexico (140). Kazakhstan and Uzbekistan tie at 130. Peru, fifth in 2005 with 208 tons, is down to 110.
| Rank | Country | 2025 (est.), t | 2024, t | Share of 2025 | Reserves, t | Years of reserves |
|---|---|---|---|---|---|---|
| 1 | China | 380 | 377 | 11.5% | 3,200 | 8 |
| 2 | Russia | 310 | 310 e | 9.4% | 12,000 | 39 |
| 3 | Australia | 280 | 284 | 8.5% | 13,000* | 46 |
| 4 | Canada | 200 | 200 e | 6.1% | 3,200 | 16 |
| 5 | United States | 160 | 163 | 4.8% | 3,000 | 19 |
| 6 | Ghana | 150 | 149 | 4.5% | 1,000 | 7 |
| 7 | Mexico | 140 | 140 | 4.2% | 1,400 | 10 |
| =8 | Kazakhstan | 130 | 130 e | 3.9% | 2,300 | 18 |
| =8 | Uzbekistan | 130 | 129 | 3.9% | 2,200 | 17 |
| 10 | Peru | 110 | 108 | 3.3% | 2,200 | 20 |
| =11 | Indonesia | 90 | 94 e | 2.7% | 3,600 | 40 |
| =11 | South Africa | 90 | 90 | 2.7% | 5,000 | 56 |
| 13 | Brazil | 80 | 82 e | 2.4% | 2,500 | 31 |
| Other countries | 1,000 | 1,020 | 30.3% | 11,000 | 11 | |
| World (rounded) | 3,300 | 3,280 | 100% | 66,000 | 20 |
e = estimated in the USGS table. All 2025 figures are estimates. *USGS says Australia's reserves are 4,500 tons if only those compliant with the Joint Ore Reserves Committee code are counted.
USGS lumps the rest into "other countries," 1,000 tons or 30% of the world. Its fuller yearbook table for 2023, the latest available, suggests no one is hiding in there: the largest unnamed producer that year was Mali, at 67 tons, below Brazil (71), the smallest country USGS names.
The next handover is already in dispute
No gold ranking is as firm as it looks, because much of this metal comes from small operators and some governments publish little. Three disagreements matter.
The first is the world total. The World Gold Council puts 2025 mine output at a record 3,672 tons, 11% above USGS. The USGS yearbook's footnotes may explain part of the gap, since some countries' figures leave out artisanal or byproduct gold, Burkina Faso's among them.
The second is Ghana. USGS has about 150 tons, but the Ghana Chamber of Mines reports 185 tons for 2025, 23% more, which would put it fifth in the USGS table, and says small-scale miners produced over half of it for the first time.
The third could change the answer at the top. In June 2026 Russia's natural resources minister said output may have reached as much as 485 tons in 2025, which would beat China easily. Russia stopped publishing detailed gold figures after the war in Ukraine began, so nobody outside can check. The Moscow Times reports that analysts and executives struggled to reconcile the number with known mines; the ministry says the figure means mined gold only, but consultancy Metals Focus (345 tons) and analyst Mikhail Leskov (about 365) both keep China first, and USGS has 310. China's figure, by contrast, is backed by its industry association's 381.3 tons. Until Russia publishes, China stays first here, with that caveat attached.
Who still has gold in the ground
Mine output and reserves tell different stories. Australia has the largest reserves in the USGS table at 13,000 tons, then Russia (12,000) and South Africa (5,000). China, the biggest miner, holds only 3,200. Divide reserves by 2025 output and China has 8.4 years of known gold left at the current pace, Ghana 6.7, and South Africa 56, because it now digs so little of what remains.
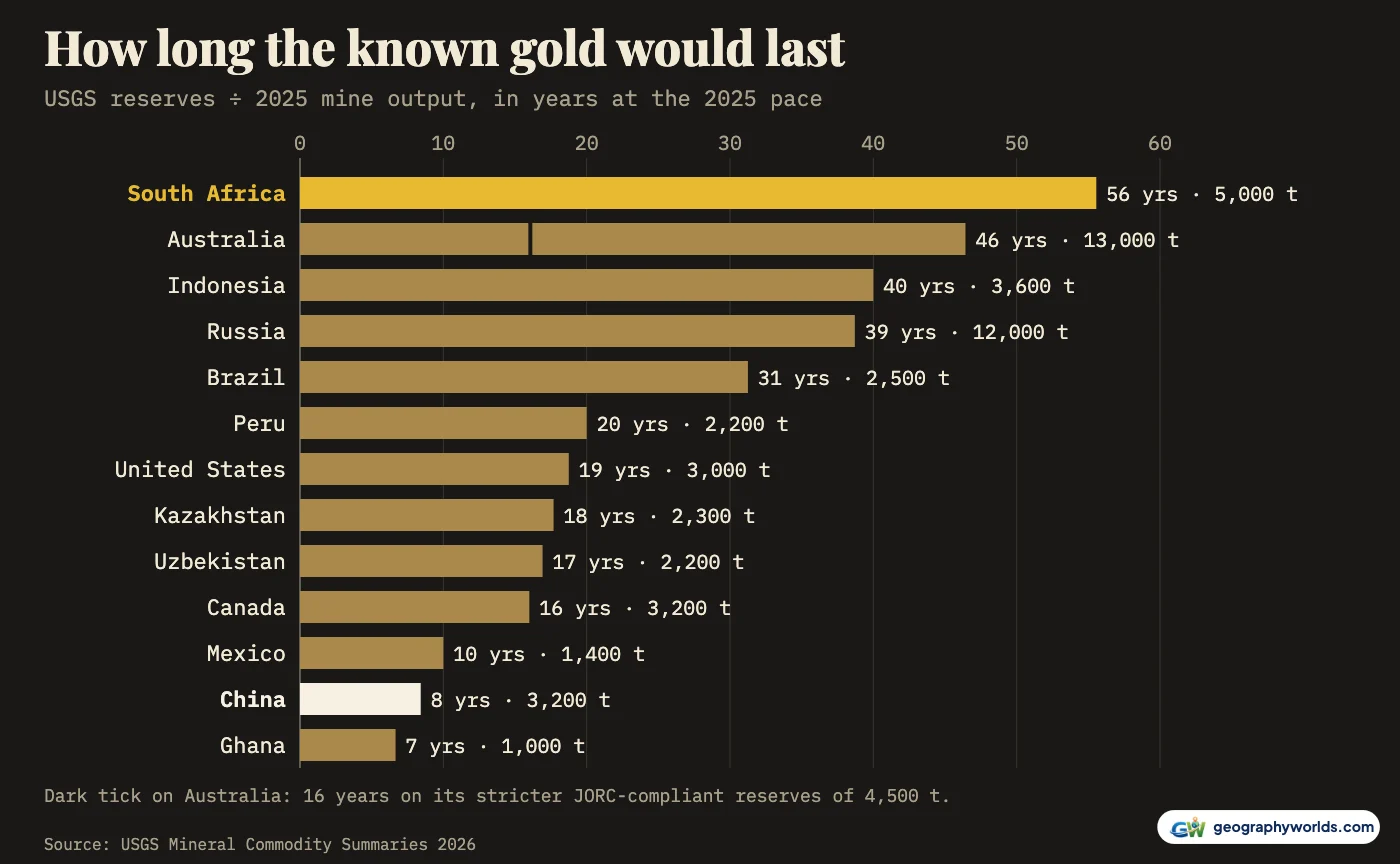
Treat those years as a pressure gauge rather than a countdown. Reserves are gold that can be mined at a profit, so a record price, about $3,300 a troy ounce on USGS's estimate for 2025, tends to enlarge them, while companies keep adding ore through exploration. South Africa's long reserve life is the mirror image of its fall: the gold is still counted, but very little of it now comes up each year. A fuller picture of where ore bodies form is in our guide to the geography of gold mining.
How we built the ranking
Output for 2024 and 2025, and reserves, come from USGS's Mineral Commodity Summaries 2026. Earlier years come from USGS and Bureau of Mines yearbook tables, converted from troy ounces where needed, using the latest edition we read that prints each year; Russia's line is the Soviet Union until 1991. Rankings count every country in each table we transcribed; before 1990 that means the leading producers rather than all of them, so the CSV leaves ranks below 12th blank for those years. You can download the data as a CSV, with every figure's source edition; drop it into Parity to follow any country's rank on a chart of your own.
- USGS, Mineral Commodity Summaries 2026: Gold: world mine production 2024 and 2025 (estimated), reserves; published February 2026; US government work, public domain
- USGS, Mineral Commodity Summaries 2026 Data Release: the same table as CSV; USGS marks the release CC0 1.0
- USGS, Minerals Yearbook: Gold, 1994 to 2023 editions: world mine production by country, 1990-2023; US government work, public domain
- US Bureau of Mines, Minerals Yearbook, 1955 to 1989 editions (scans at the Internet Archive): gold world production tables for 1960-1985, in troy ounces; US government work, public domain. The link is the 1972 volume; the CSV names the edition and page of every figure
- Annual Report of the Director of the Mint, 1906, table 22: world production of gold, 1903, 1904 and 1905; US government work, public domain
- World Gold Council, Gold Demand Trends: Full Year 2025: world mine production 2024 and 2025
- The Moscow Times, Russia Says Gold Production Nears 500 Tons (June 2026): the Russian minister's claim and analysts' responses
Gold made South Africa's mining industry, but it is no longer the whole of it: our guide to South Africa's natural resources covers the platinum and chromium that sit alongside what is left of the Witwatersrand.