
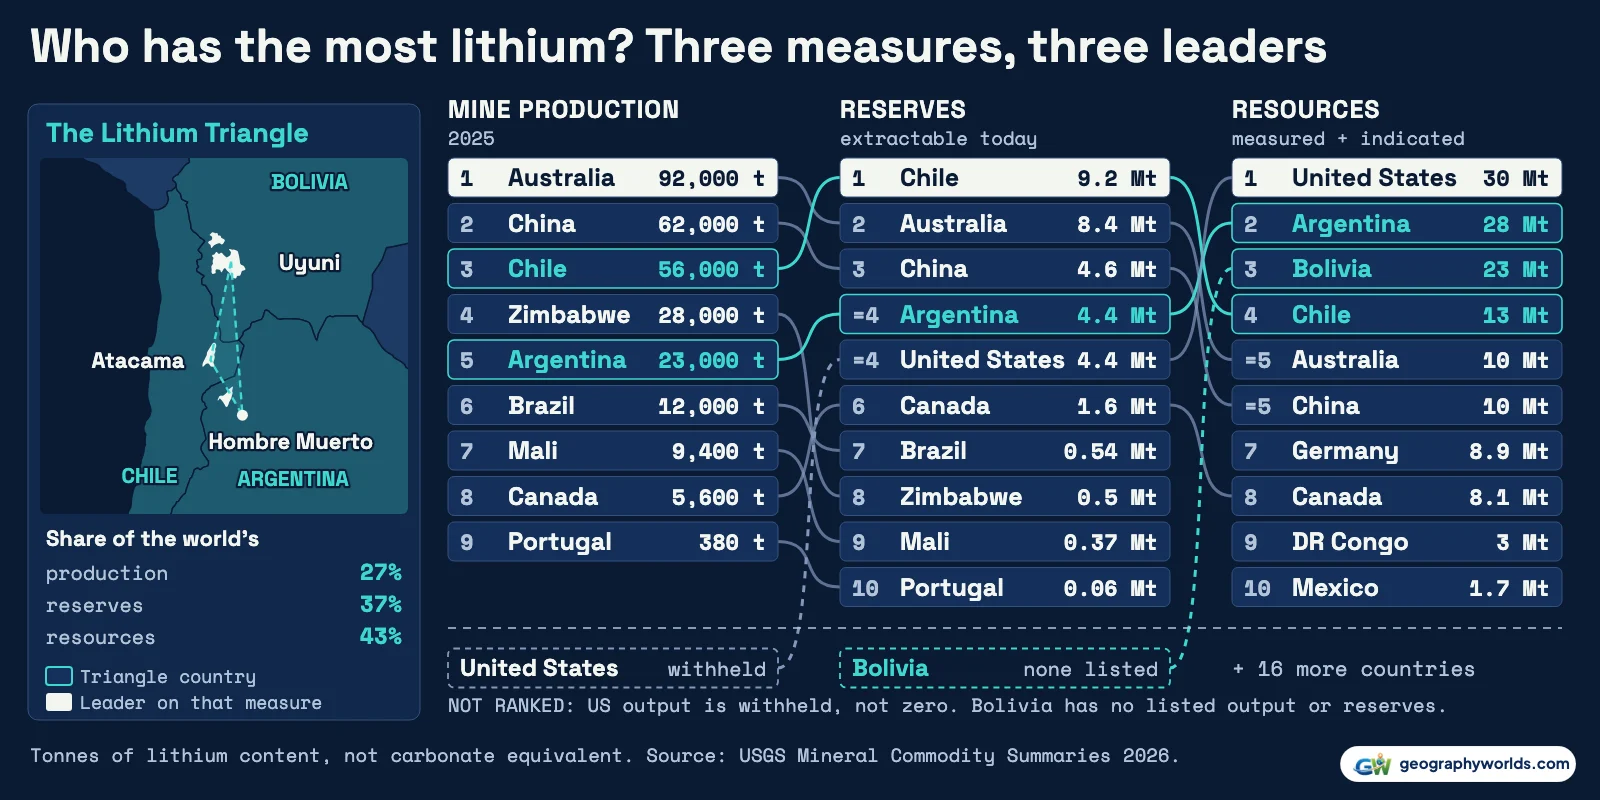
Australia mines the most lithium: an estimated 92,000 tonnes of lithium content in 2025, or 31.7% of the 290,000-tonne world total in the U.S. Geological Survey's Mineral Commodity Summaries 2026, ahead of China (62,000 t) and Chile (56,000 t). In the ground the order changes. On USGS's count, Chile holds the largest reserves at 9.2 million tonnes, followed by Australia at 8.4 million tonnes and China at 4.6 million tonnes. The United States has the largest measured and indicated resources, on USGS's tally and only since this edition, at 30 million tonnes, ahead of Argentina at 28 million tonnes and Bolivia at 23 million tonnes. USGS withholds US mine output to protect company data, so the United States is unranked on production and left out of the world total. It is not zero.
Three measures that answer three different questions
Mine production is one year's output; the 2025 figures are estimates. Reserves are what USGS calls the part of a deposit that "could be economically extracted or produced at the time of determination", so they move with prices and with what companies report. Resources are the wider pool of lithium that has been measured or indicated by drilling and sampling, whether or not anyone could profit from it today. That is how Australia can be first, second or joint fifth depending on the column.
All three columns here are in tonnes of lithium content. Many company reports use lithium carbonate equivalent instead, and one tonne of lithium equals 5.32 tonnes of carbonate, so an LCE figure looks about five times larger for the same metal. This article converts them.
| Country | Mine production 2025 (t) | Reserves (Mt) | Resources (Mt) | Reserves ÷ 2025 output (years) |
|---|---|---|---|---|
| United States | withheld | 4.4 | 30 | n/a |
| Argentina | 23,000 | 4.4 | 28 | 191 |
| Bolivia | none listed | none listed | 23 | n/a |
| Chile | 56,000 | 9.2 | 13 | 164 |
| Australia | 92,000 | 8.4 | 10 | 91 |
| China | 62,000 | 4.6 | 10 | 74 |
| Canada | 5,600 | 1.6 | 8.1 | 286 |
| Brazil | 12,000 | 0.54 | 1.4 | 45 |
| Mali | 9,400 | 0.37 | 1.2 | 39 |
| Zimbabwe | 28,000 | 0.5 | 0.86 | 18 |
The last column divides reserves by 2025 output. It is arithmetic, not a forecast, but it shows how differently the producers are placed: Argentina could run for 191 years at last year's rate and Chile for 164, against 91 for Australia and 18 for Zimbabwe.
The American lead on resources is new. Last year's edition had Argentina and Bolivia level at the top on 23 million tonnes each and the United States on 19 million tonnes. This edition lifted the US figure to 30 million tonnes, its reserves from 1.8 million tonnes to 4.4 million tonnes, and the world's resources from 115 million tonnes to 150 million tonnes, citing continued exploration and company and government reports.
Australia digs its lithium out of hard rock
Australia's output comes from what USGS counts as seven mineral operations, mining spodumene, a lithium-bearing mineral found in pegmatites, which are coarse-grained igneous bodies. The best known is Greenbushes in Western Australia, a pegmatite USGS geologists describe as large for its type at 3 kilometres long and a few hundred metres across. The ore is crushed and upgraded into a concentrate. USGS put the price of that concentrate, at 6% lithium oxide, at about $800 a tonne in January 2025 and about $970 in November.

Australia's own numbers run higher than the American ones. Geoscience Australia's preliminary tables, last updated in October 2026, put 2025 production at 118,000 tonnes of a 314,000-tonne world total, 28% above the USGS figure for Australia. The agency converts spodumene output by assuming 6% lithium oxide in concentrate. Australia is first on both counts.
Reserves are less tidy. The 8.4 million tonnes above carries a USGS footnote: reserves compliant with Australia's JORC reporting code or an equivalent are 5.1 million tonnes, close to Geoscience Australia's 4.98 million tonnes of Ore Reserves at the end of 2025. Australia stays second to Chile on the stricter figure. But the agency's broader Economic Demonstrated Resources stand at 9.58 million tonnes, which would pass Chile's 9.2 million tonnes. Geoscience Australia's own table now ranks Australia first in the world on that basis, with 25%. USGS's 8.4 million tonnes is close to the agency's figure for two years earlier (8.44 million tonnes), so Chile's lead may be partly a matter of date. The ranking above keeps to a single source. Our guide to the natural resources of Australia covers iron ore, coal and the rest.
The Andean salt flats let the sun do the work
Across the Pacific the lithium is dissolved. In the high, dry basins where Chile, Argentina and Bolivia meet, salty groundwater holds lithium under crusts of salt. Companies pump it into shallow ponds and leave the sun to evaporate it, draining it from pond to pond as other salts crystallise out. It is slow: at Clayton Valley in Nevada, reaching a useful concentrate takes nearly two years.
What the Atacama has is richness. The same USGS paper gives the Salar de Atacama an average of 1,400 parts per million of lithium, against 160 at Clayton Valley, and calls it the world's most significant lithium district. That helps explain the table: Chile runs only two brine operations yet ranks third in output and first in reserves. NovaAndino, the SQM and Codelco venture completed in December 2025, reported 233,000 tonnes of LCE for 2025 on the salar, or about 43,800 tonnes of lithium, equal to 78% of the USGS figure for all of Chile. Our profile of the natural resources of Chile sets this beside the country's copper.

Chile's own statistics disagree with USGS for 2024. The copper commission Cochilco reports 296,908 tonnes of LCE, about 55,800 tonnes of lithium, which is 14% above the 48,900 tonnes USGS lists. We found no published explanation, so treat Chile's line as a range. Argentina's reconcile better: its mining secretariat's 120,000 tonnes of LCE for 2025 is about 22,500 tonnes of lithium, close to the 23,000 USGS gives, up 67% from 13,800 tonnes in 2024.
Bolivia is the strange case. It holds 23 million tonnes of resources, third in the world, and USGS lists it among countries developing brine projects, yet it has no line in the production table and no line in the reserves table. Together the three countries of the Lithium Triangle hold 64 million tonnes of resources, 43% of the world total, and 37% of reserves, but delivered only 27% of 2025 mine production.
Rock against brine, tonne by tonne
The USGS list of operations makes it possible to sort the 2025 total by deposit type. Countries whose output comes from mineral operations (Australia, Zimbabwe, Brazil, Mali, Canada and Portugal) mined 147,380 tonnes, 51% of the named total. Chile and Argentina, both on brine, produced 79,000 tonnes, 27%. China's 62,000 tonnes, the remaining 21%, cannot be split because USGS publishes one national number for nine mineral and six brine operations.
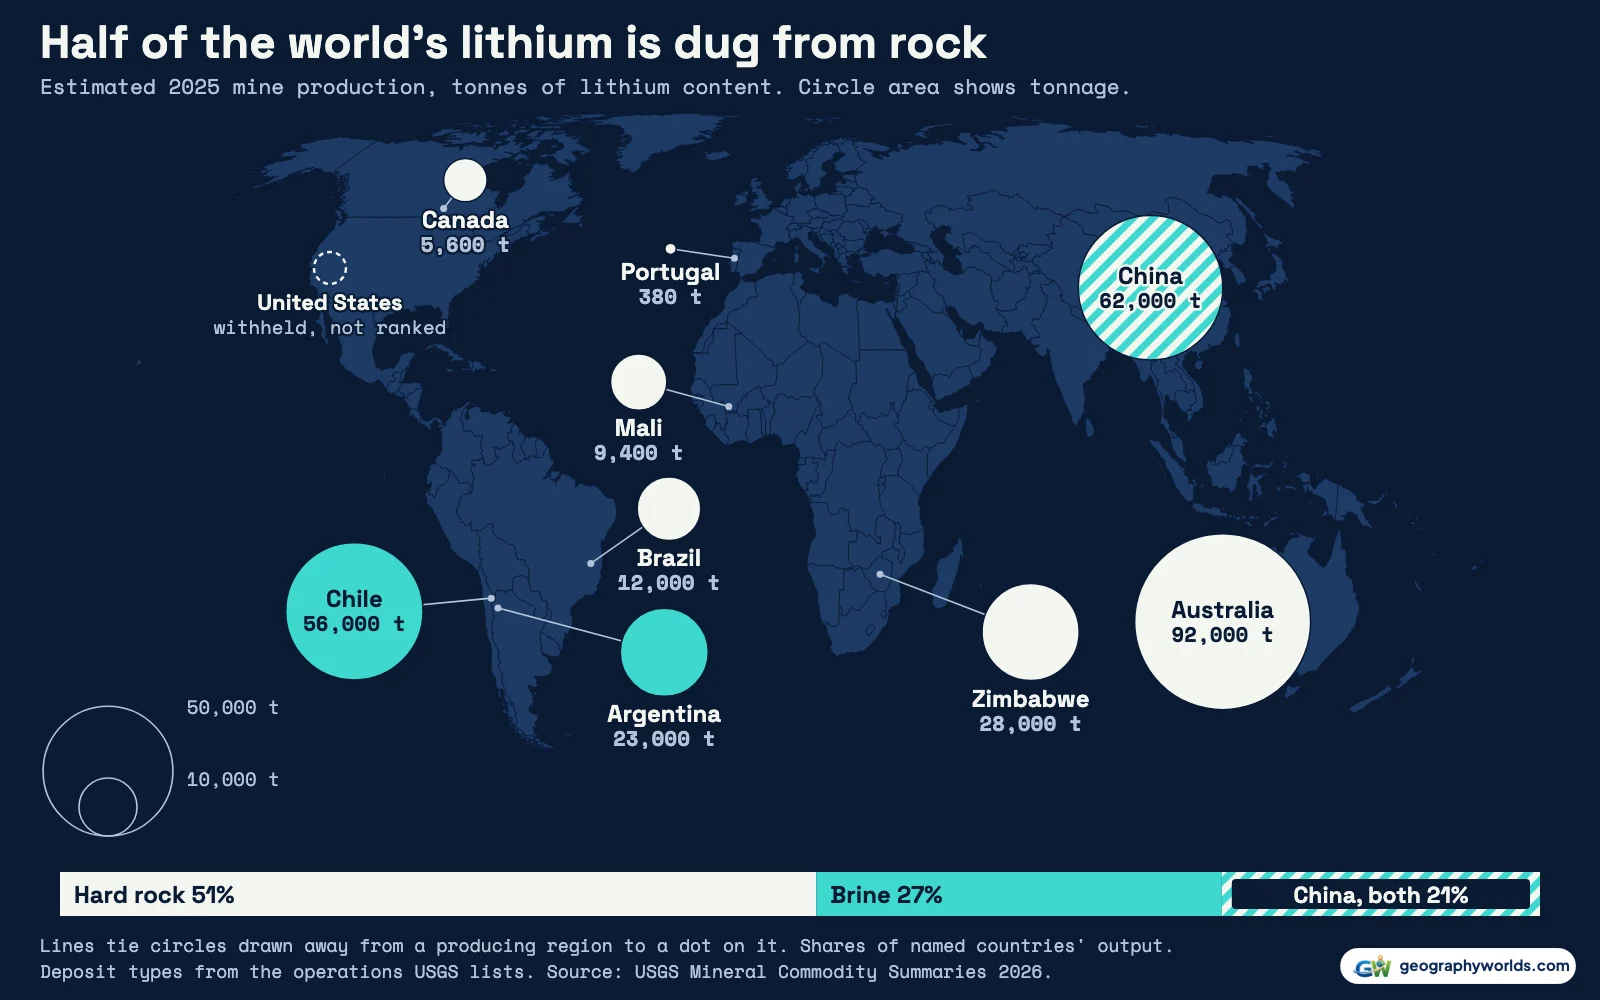
The price slump tested both kinds of mine. USGS's annual US carbonate price peaked at $63,700 a tonne in 2022 and fell to $11,800 in 2024 and $9,000 in 2025, yet output rose over those last two years from 222,000 tonnes to about 290,000, against estimated 2025 consumption of 263,000 tonnes.
China sits in both camps, and downstream of everyone else
China's 62,000 tonnes were up 50% from 41,400 in 2024, the largest absolute gain of any country, and leave it 30,000 tonnes behind Australia on the USGS count. The consultancy Fastmarkets forecast in June 2025, Reuters reported, that China would pass Australia in 2026 by 8,000 to 10,000 tonnes. That is a projection.
On reserves the sources part ways again. USGS raised China from 3 million tonnes to 4.6 million tonnes, 12.4% of the world and third place. The China Geological Survey said in January 2025 that the country's share had risen from 6% to 16.5%, taking it to second, after surveying a 2,800-kilometre spodumene belt in the west. That report gave no tonnage, so the two cannot be reconciled.
Mining is the smaller half of China's position. The same Reuters report put it at roughly 70% of world lithium refining, with Fastmarkets expecting about 60% by 2035. Chinese firms including Huayou, Sinomine and Chengxin have invested heavily in Zimbabwe, which rose from 20,000 to 28,000 tonnes and sends most of its concentrate to China. In Mali, where output jumped from 770 to 9,400 tonnes, the Goulamina mine is 65% owned by Ganfeng Lithium, with the Malian side holding the rest.
That arrangement is under pressure. Zimbabwe suspended concentrate exports in February 2026, began issuing quotas after April, and as of October 2026 said a full ban would start in January 2027. Cobalt, another battery metal, has a similarly narrow map, set out in our guide to the geography of cobalt mining.
What the resource column does not promise
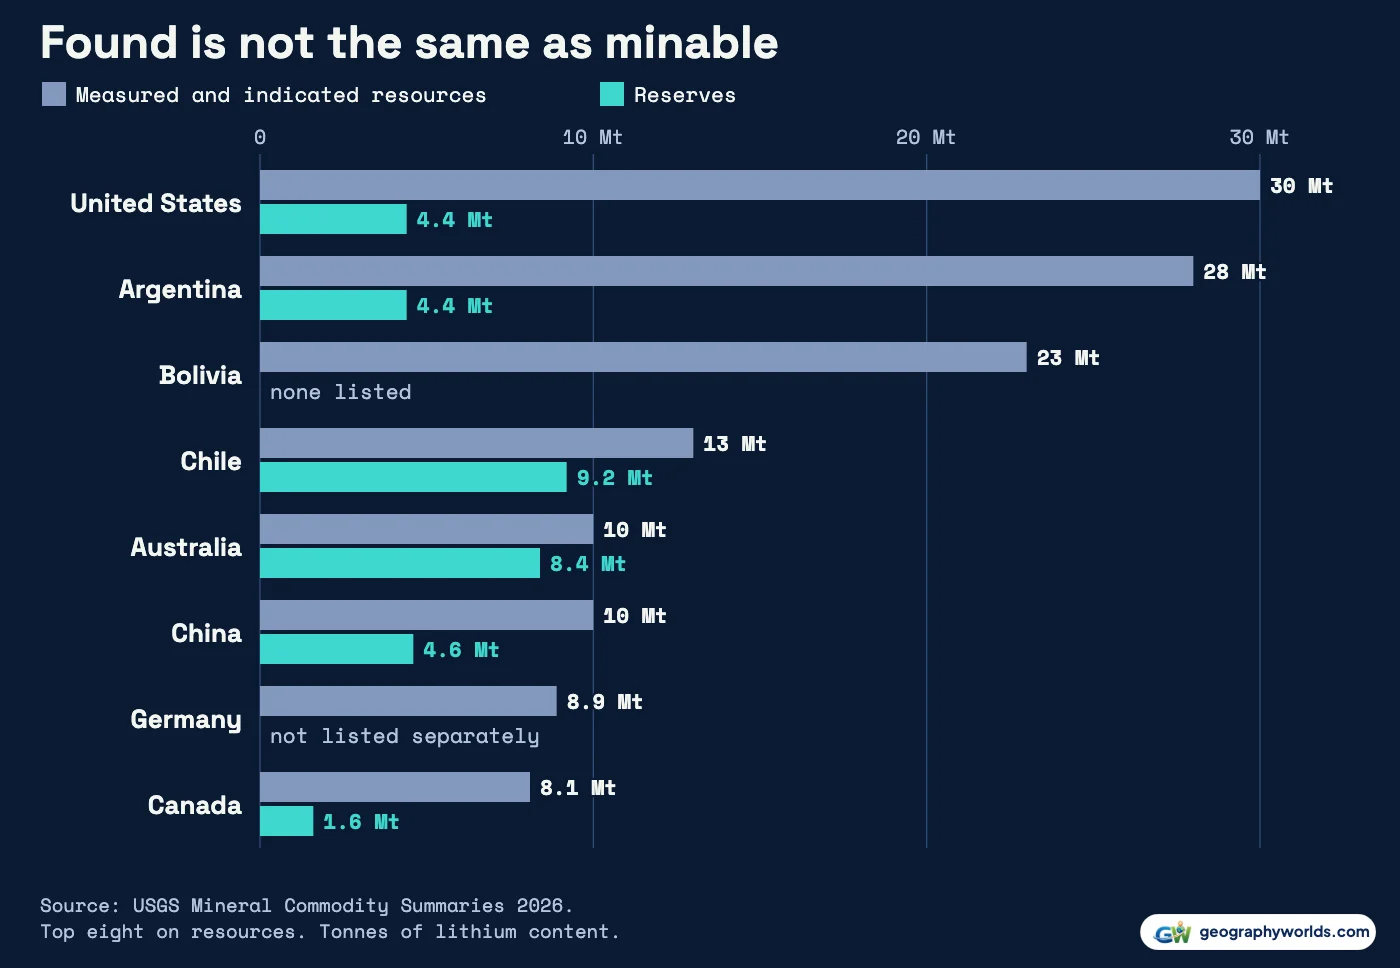
Divide reserves by resources and the top of the third column looks less solid. Australia's reserves equal 84% of its resources and Chile's 71%, against 16% for Argentina and 15% for the United States. The US total spans continental, geothermal and oilfield brines, claystone, hectorite and pegmatites, yet USGS reports commercial-scale production from just one continental brine operation in Nevada. USGS's own study of Arkansas brines estimated 5 to 19 million tonnes in place and said plainly that it did not consider whether extraction was technically or economically feasible. Germany, seventh on resources at 8.9 million tonnes, has no line in the production table at all.
A high resource figure means geology that has been counted; reserves are the portion someone could profit from when assessed. With 26 countries on the resource list and nine ranked on production, future supply depends on how much crosses from one column to the other.
Where these numbers come from
Production and reserves come from the USGS data release and resources from the chapter's text, because USGS publishes those only in prose. World totals are as USGS rounds them, and they exclude US production. Shares of deposit type use the sum of named countries instead. You can download the data as a CSV with all three measures, ranks and deposit type for every country listed; load it into Parity if you would like to redraw any column as your own chart.
- U.S. Geological Survey, Mineral Commodity Summaries 2026: Lithium: 2024 and 2025 mine production, reserves and measured and indicated resources, metric tons of lithium content; published February 2026; US government work, public domain
- U.S. Geological Survey, Mineral Commodity Summaries 2026 data release: the same production and reserves tables as CSV; public domain
- U.S. Geological Survey, Mineral Commodity Summaries 2025: Lithium: last year's reserves and resources, for comparison; public domain
- Bradley and others, Lithium, chapter K of USGS Professional Paper 1802 (2017): brine and pegmatite geology; public domain
- Geoscience Australia, Australia's Identified Mineral Resources 2025 and 2026 preliminary tables: Australian production and resources, quoted for comparison and not in the CSV
- Natural Earth country outlines (via world-atlas) and playas: public domain
For the geology behind these rankings, from how pegmatites form to why brines gather in closed basins, carry on with our longer account of lithium deposits around the world.