
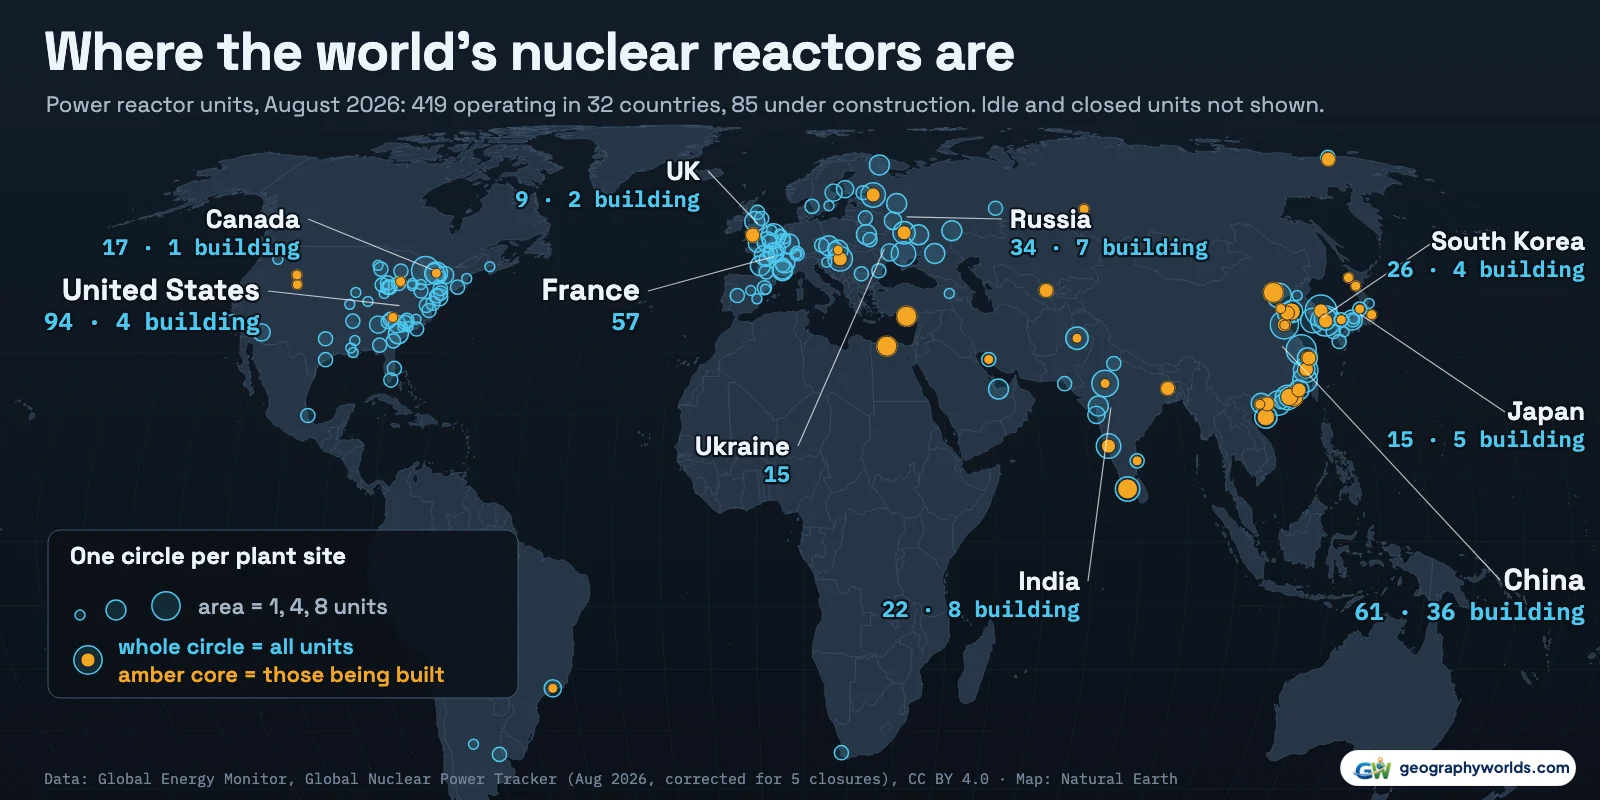
The United States has the most nuclear reactors of any country: 94 power reactors in operation, according to Global Energy Monitor's Global Nuclear Power Tracker (August 2026 release, corrected for five reactors closed since). China is second with 61, France third with 57, then Russia (34), South Korea (26), India (22) and Canada (17), with Japan and Ukraine tied on 15 each. Under construction, the order changes completely: China is building 36 of the world's 85 reactors under construction, 42% of the total, far ahead of India (8) and Russia (7). Worldwide, 419 reactors are operating in 32 countries.
A "reactor" here means a nuclear power unit: one reactor whose heat drives a turbine and generator on the grid, which is how the tracker defines a unit. A plant such as Gravelines in France holds several. Research reactors and the reactors that power ships and submarines are not in the count. "Operating" means the unit has entered commercial operation; "under construction" means work is under way on the site. Units the tracker calls mothballed, a category that covers both disused reactors and ones never finished, such as Virgil C. Summer 2 and 3 in South Carolina, are left out of the operating column and shown separately below.
We made one correction to the tracker. Its August 2026 release still lists five reactors as operating that have since closed for good: Belgium's Doel 1 (shut in February 2025), Tihange 1 (30 September 2025) and Doel 2 (late 2025), and Canada's Pickering 1 and 4, which closed in September and at the end of 2024. We count them as closed, which brings the tracker's 424 operating reactors down to 419, Belgium to 2 and Canada to 17.
The ranking: 94 American reactors, then China and France
The United States runs 94 power reactors with 102.5 gigawatts (GW) of capacity, 22% of the world's reactors and 25% of the world's 404.8 GW. The US Energy Information Administration (EIA) gives the same count: 94 operating commercial reactors at 54 power plants in 28 states as of March 2026. The three biggest fleets, the United States, China and France, hold 212 reactors between them, 51% of all those operating.
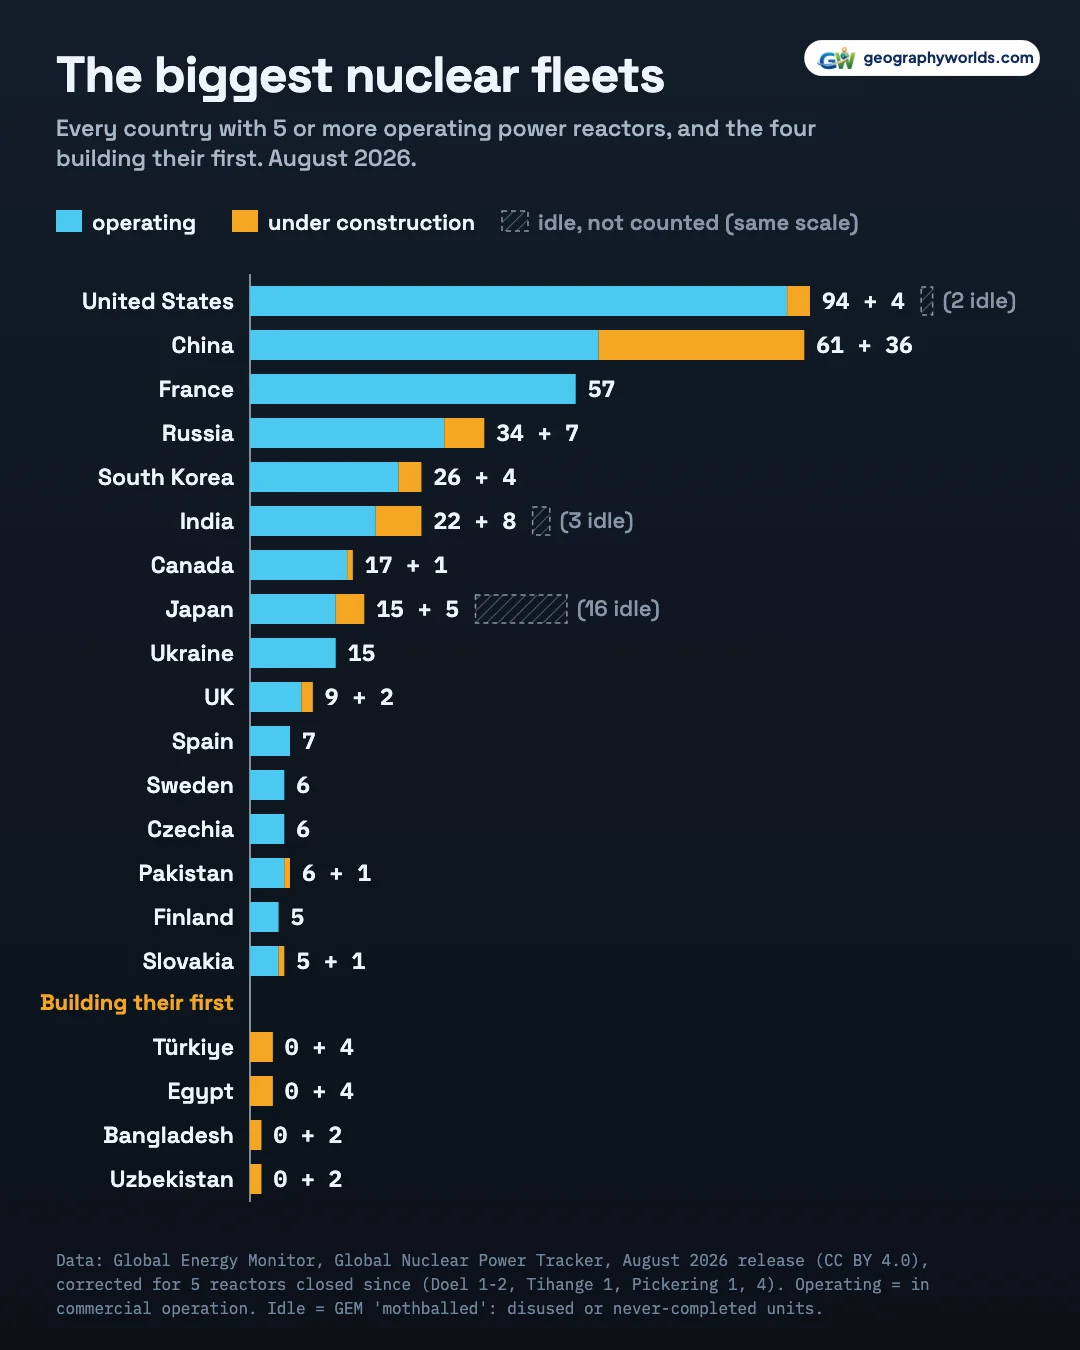
Count capacity instead of reactors and France edges China: 65.7 GW from 57 reactors against China's 64.6 GW from 61, because every French unit is large: from 917 to 1,650 megawatts of nameplate capacity. Russia's 34 reactors add up to 29.8 GW. Further down the list the numbers fall quickly: after the United Kingdom's 9, no country runs more than seven.
| # | Country | Operating units | Operating capacity, GW | Under construction | Idle (mothballed) | Nuclear share of electricity, 2024 | WNA operable count |
|---|---|---|---|---|---|---|---|
| 1 | United States | 94 | 102.5 | 4 | 2 | 17.8% | 94 |
| 2 | China | 61 | 64.6 | 36 | – | 4.4% | 65 |
| 3 | France | 57 | 65.7 | – | – | 67.3% | 57 |
| 4 | Russia | 34 | 29.8 | 7 | – | 18.6% | 34 |
| 5 | South Korea | 26 | 27.1 | 4 | – | 32.7% | 26 |
| 6 | India | 22 | 8.4 | 8 | 3 | 2.7% | 24 |
| 7 | Canada | 17 | 13.5 | 1 | – | 13.4% | 17 |
| 8= | Japan | 15 | 14.6 | 5 | 16 | 9.1% | 33 |
| 8= | Ukraine | 15 | 13.8 | – | – | 53.6% | 15 |
| 10 | UK | 9 | 6.5 | 2 | – | 13.9% | 9 |
| 11 | Spain | 7 | 7.4 | – | – | 19.5% | 7 |
| 12= | Sweden | 6 | 7.2 | – | – | 29.1% | 6 |
| 12= | Czech Republic | 6 | 4.2 | – | – | 40.3% | 6 |
| 12= | Pakistan | 6 | 3.5 | 1 | – | 15.2% | 6 |
| 15= | Finland | 5 | 4.6 | – | – | 39.3% | 5 |
| 15= | Slovakia | 5 | 2.5 | 1 | – | 64.4% | 5 |
The table also shows where counts disagree. The World Nuclear Association (WNA), the industry's trade body, counts reactors that are "operable", which it defines as connected to the grid, and its October 2026 table gives the world 442 rather than 419. Most of the gap is Japan. Global Energy Monitor counts 15 Japanese reactors in operation. The Japan Atomic Industrial Forum's August 2026 status table lists 33 reactors, and the two counts reconcile exactly: 15 running, 15 idle reactors that have operated before (the tracker calls them mothballed), and three finished reactors awaiting restart, Kashiwazaki-Kariwa 7, Tokai 2 and Tomari 3, which the tracker files under construction. The WNA counts all 33 as operable. The EIA says the same in its own words: after Kashiwazaki-Kariwa 6 restarted on 9 February 2026, Japan had 15 operating reactors out of 32 operable ones. On the WNA's definition Japan is the fifth-largest fleet; on the count of reactors actually running it is joint eighth.
China shows the opposite effect. The WNA lists 65 Chinese reactors as operable, counting from grid connection, while the China Nuclear Energy Association's April 2026 report counted 60 units in commercial operation. After our correction for the five closures, Belgium (2) and Canada (17) match the WNA; India is the one remaining gap, 24 on the WNA's table against 22 here. None of these differences moves the top four.

Ukraine's 15 include the six reactors at Zaporizhzhia, which the tracker still lists as operating although the Russian-occupied plant has not generated electricity since September 2022. One more entry looks odd in a list of power stations: North Korea's single operating unit is the 5-megawatt reactor at Nyongbyon, a Magnox-type gas-cooled unit that the tracker lists among power reactors. It is why the count reaches 32 countries.
Who is building: 36 of 85 new reactors are in China
The map at the top of this page shows the build-out in amber. China has 36 reactors under construction, 43.4 GW of new capacity, more than four times India's 8. Russia is building 7, and South Korea, the United States, Türkiye and Egypt 4 each. The tracker also lists 5 for Japan, but only two of those are new builds. In all, 17 countries have at least one reactor under construction, totalling 90.9 GW. The WNA's count differs in detail, 38 in China out of 80 worldwide, but it also puts China first by a wide margin.
Four countries on that chart have never run a commercial reactor: Türkiye (4), Egypt (4), Bangladesh (2) and Uzbekistan (2). Together they account for 12 of the reactors being built. The United Arab Emirates shows where such a programme can lead: it now runs four reactors, has none left under construction, and got 23.1% of its electricity from them in 2024.
Two of the construction counts need a closer look. In the United States, the tracker's 4 units, 1,197 megawatts in all, are not conventional new builds: they are the restart of the closed Palisades plant in Michigan, TerraPower's 345-megawatt sodium-cooled unit at Kemmerer in Wyoming, Kairos Power's Hermes 2 in Tennessee, which will supply up to 50 megawatts, and Project Pele, a 2-megawatt Department of Defense microreactor in Idaho. The WNA lists no American reactors under construction. In Japan, the tracker's 5 are Ohma 1 and Shimane 3, two large reactors whose construction the WNA notes has been suspended, plus the three finished reactors waiting to restart; the WNA counts only the first 2.
China's build-out, one reactor at a time
China's fleet is young. By the tracker's dating, its first reactors entered operation in 1994, and by the end of 2009 it had added only 11. Since 2010 it has added 50, peaking at 7 a year in 2016 and again in 2018, and 3 more had entered operation in 2026 by the time of the August release. Over the same period the United States brought 3 new reactors into service.
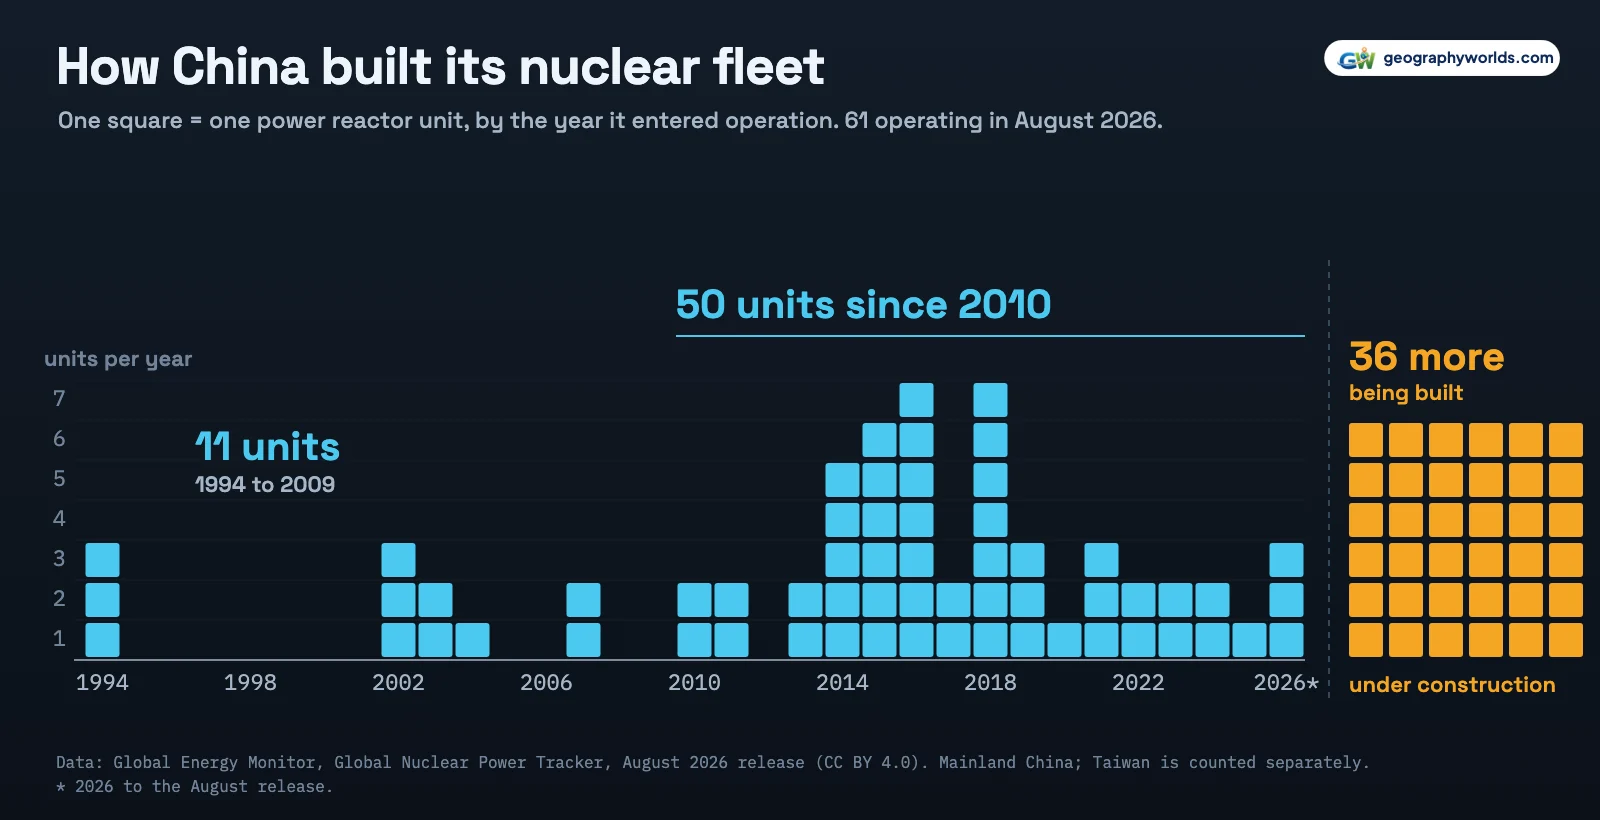
The amber block at the right of that chart is the important part. If China's 36 reactors under construction are completed, its fleet would reach 97, against 98 for the United States counting its 4 projects. Construction times vary and some projects stall, so this is a comparison of today's pipelines, not a forecast of when China will lead.

Even so, nuclear is a small part of China's electricity. Its reactors generated 451 billion kilowatt-hours in 2024, the second-largest output of any country, but that was only 4.4% of the country's total generation, because China generates so much electricity overall: 10,162 billion kilowatt-hours in 2024. That gap between the size of a fleet and its weight in the grid is the subject of the last part of this ranking.
Where nuclear supplies the most electricity
Measured by the share of electricity it supplies, nuclear power matters most in France. In 2024 French reactors generated 362 billion kilowatt-hours out of 537 billion, 67.3% of the country's electricity, according to the EIA's International Energy Statistics. The French grid operator RTE reported the same nuclear output, 361.7 terawatt-hours of 536.5 produced, and the WNA puts France's 2025 share at 68.1%.
Only two other countries got more than half their electricity from nuclear in 2024: Slovakia (64.4%) and Ukraine (53.6%). Hungary (41.0%) and Finland (39.3%) follow. In all, 12 countries generated at least 30% of their electricity from nuclear, and 11 of them are in Europe; the exception is South Korea, at 32.7%.
The big fleets sit lower on this measure. The United States generated 782 billion kilowatt-hours from nuclear in 2024, more than any other country, yet that was 17.8% of its electricity. Russia's share was 18.6%, the United Kingdom's 13.9%, Canada's 13.4%, Japan's 9.1% and India's 2.7%. Across the world, nuclear produced 2,735 billion kilowatt-hours in 2024, 8.9% of all electricity. Taiwan still appears in the 2024 figures, at 4.3%, although the WNA notes that its last reactor shut down in May 2025, and it has no operating reactors in the August 2026 count.
Where the fuel for all these reactors comes from is a different map again, covered in our guide to uranium mining.
About the numbers
Reactor counts come from Global Energy Monitor's Global Nuclear Power Tracker, August 2026 release, which lists every nuclear power unit ever proposed, built or closed, 1,825 in all, with its status, capacity and location; we counted units by status, checked the totals against the tracker's own summary tables, and then moved the five reactors closed in 2024 and 2025 from operating to closed. The data is used under CC BY 4.0, via GEM's Creative Commons Public License page. Electricity shares are nuclear net generation divided by total net generation in 2024, from the EIA's International Energy Statistics (updated 24 February 2026). The World Nuclear Association, EIA, China Nuclear Energy Association and RTE figures are quoted for comparison only.
The full table, with every country's operating, under-construction, idle, planned and retired units, its capacity, its 2024 generation and China's additions year by year, is free to download the data as a CSV; anyone who would like to put the trackers' counts side by side can open it in Parity, which turns a spreadsheet into charts.
- Global Energy Monitor, Global Nuclear Power Tracker, August 2026 release: Every nuclear power unit worldwide with its status, capacity and location; summary tables 'Nuclear Power Unit Count by Country/Area' and 'Nuclear Power Units Added by Year & Country/Area'. CC BY 4.0, via GEM's Creative Commons Public License page (globalenergymonitor.org/creative-commons-license). We count five units the release still lists as operating as closed: Doel 1, Doel 2, Tihange 1, Pickering 1 and 4.
- US Energy Information Administration, International Energy Statistics, bulk file INTL.zip: Nuclear and total electricity net generation by country, 2024, billion kWh; series updated 24 February 2026. Public domain.
- World Nuclear Association, World Nuclear Power Reactors & Uranium Requirements (updated 8 October 2026): Operable (grid-connected) and under-construction reactors and 2025 nuclear share by country. Quoted for comparison only; not in the CSV.
- Natural Earth admin-0 countries via the world-atlas package: Public domain. Land outlines for the map.
Nuclear is one of several low-carbon sources competing to replace coal and gas; for the fastest-growing of them, see which countries have the most solar power.