
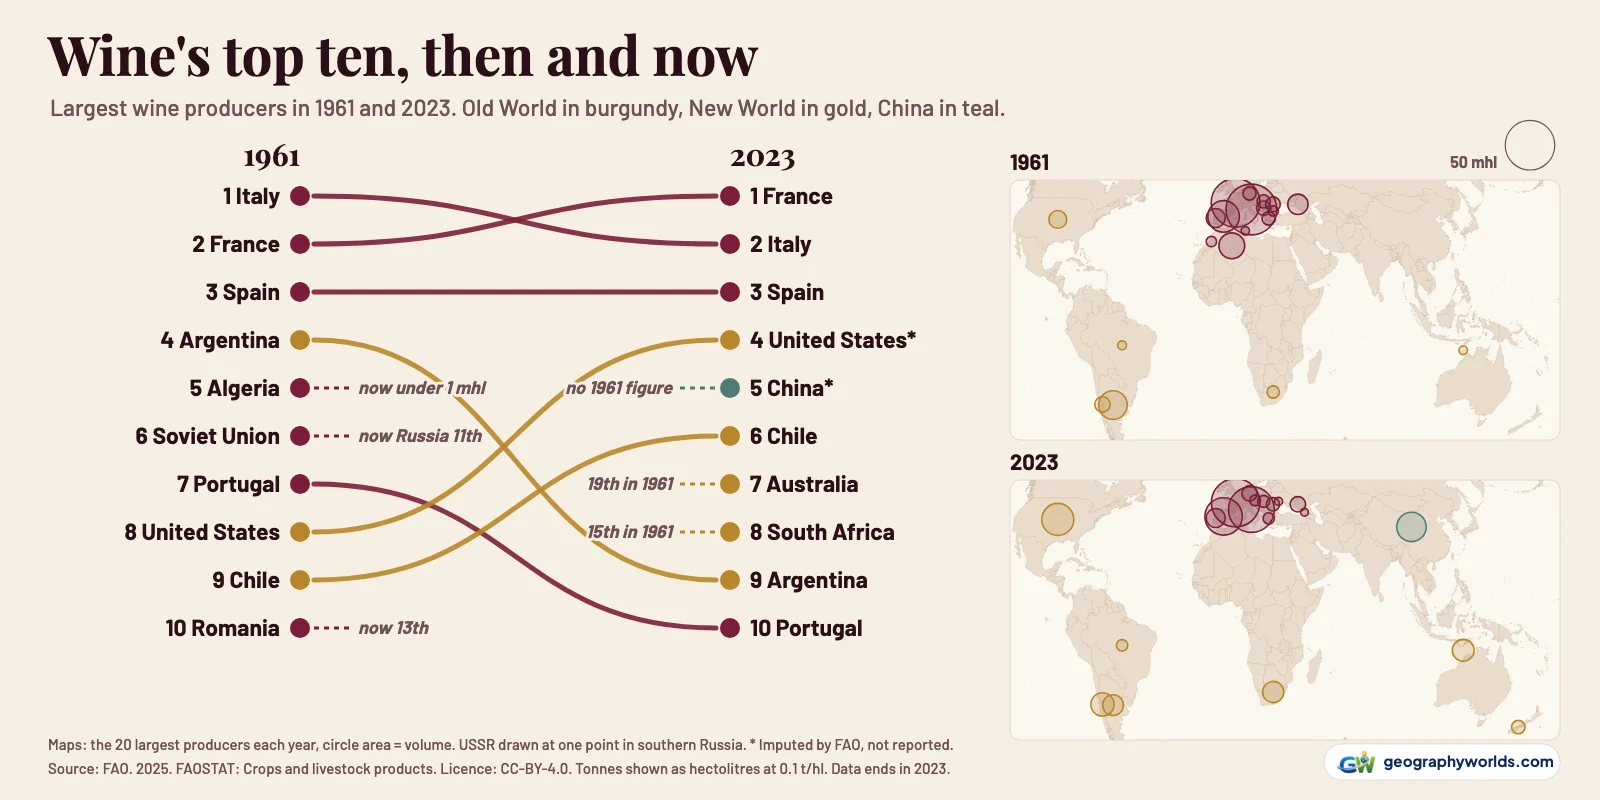
France produces the most wine of any country in the latest global data: 47.6 million hectolitres (mhl) in 2023, about 19% of the world's 244 mhl, according to FAOSTAT, the database of the UN Food and Agriculture Organization (FAO). That data ends in 2023, so this ranking does not cover the 2024 or 2025 harvests. Italy is second with 42.5 mhl and Spain third with 28.5, followed by the United States (20.8), China (17.6), Chile (11.0), Australia (9.6), South Africa (9.2), Argentina (8.8) and Portugal (7.4). FAO imputed the American and Chinese figures rather than receiving them from those countries, and China's is far above its own industry's count.
One hectolitre is 100 litres, so France's 2023 harvest is about 4.8 billion litres. The top three are the same countries as in 1961, the first year of FAO's records, when Italy made 52.5 mhl, France 48.6 and Spain 20.2. Almost everything below them has moved. This page compares the two years country by country, using one source for both, and a later section gives what national statistics offices have published since.
France and Italy: two countries trading first place
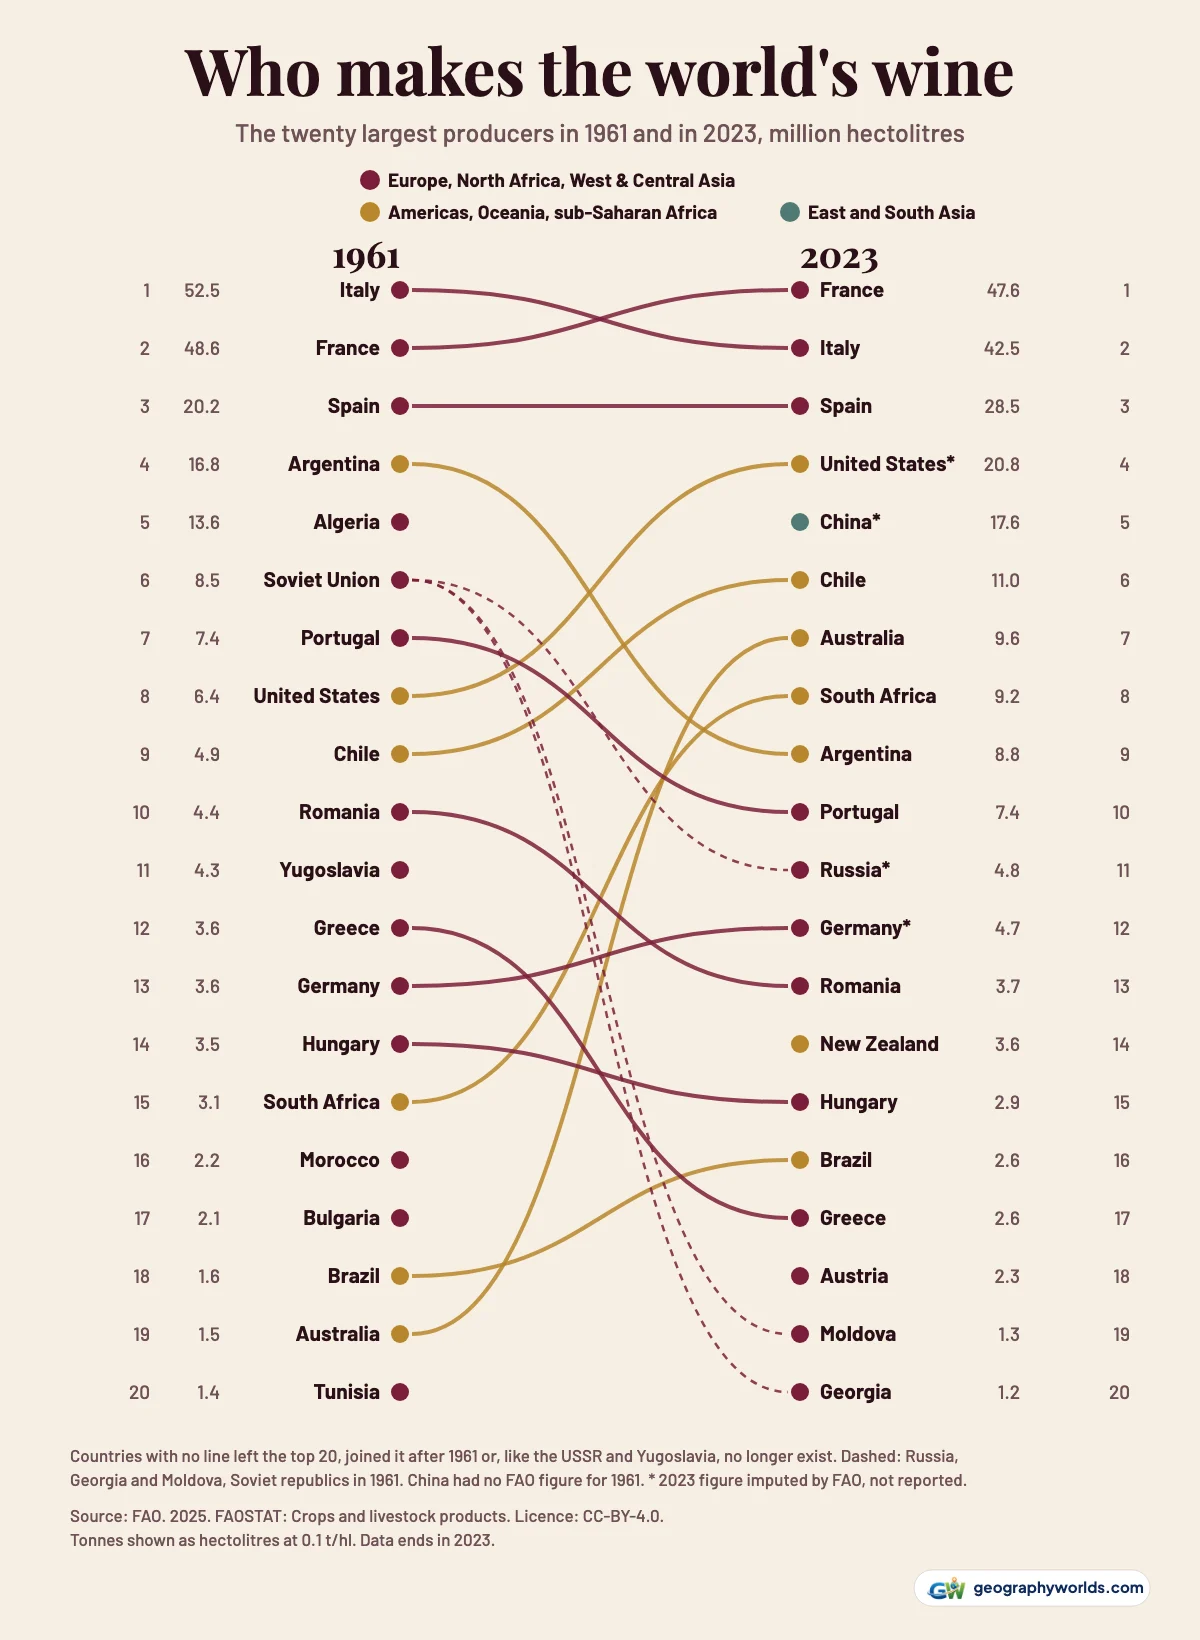
In 1961 Italy made 24% of the world's wine and France almost as much; with Spain the three made 56% of it. In 2023 the same three made 49%. Their lead has narrowed because others grew while the two biggest shrank: France's 47.6 mhl and Italy's 42.5 are both below their 1961 volumes.
The order between them swings with the weather. Across FAO's 63 years, Italy outproduced France in 35 and France outproduced Italy in 28. Italy led every year from 2015 to 2022, and France's first place in 2023 owes more to Italy's fall than to any French gain: Italy dropped from 54.0 mhl to 42.5, while France rose from 46.1 to 47.6. Our France vs Italy comparison covers how the two countries differ beyond the vineyard.

Spain: 20.2 million hectolitres then, 28.5 now
Spain is the one member of the podium that makes more now than in 1961. Even so, 2023 was a poor year: FAO has it down 22% from 36.4 mhl, Spain's lowest figure since 1995. Harpers, reporting the trade body Food and Wines from Spain, gives a higher 34 mhl for 2023 and blames droughts, heatwaves and hail. That report does not say whether its total includes grape must, which would explain part of the gap.
Argentina and Chile: fourth and ninth, now ninth and sixth
Argentina was the largest producer outside Europe in 1961, fourth in the world with 16.8 mhl. FAO has it peaking at 28.2 mhl in 1976, then 23.5 mhl in 1980 and 8.8 mhl in 2023, the lowest figure in the whole series and 9th in the world. Chile went the other way, from 4.9 mhl and 9th place to a peak of 13.4 mhl in 2021, then 11.0 in 2023 and 6th place. Chile has outproduced Argentina every year since 2021, and before that only in 2012 and 2016. Our guide to the climate of Argentina covers the growing conditions behind its vineyards.
Algeria: fifth in 1961, a rounding error today
The biggest change in the table is a country that has almost stopped making wine. Algeria made 13.6 mhl in 1961, fifth in the world in FAO's figures, and 15.0 mhl in 1962 (an FAO estimate), the year it became independent from France. An account in The Globe and Mail (2013) of a study by Giulia Meloni and Jo Swinnen, published in 2014, gives the same 15 million hectolitres for 1962 but ranks Algeria fourth in 1961; FAO puts Argentina ahead of it. The same article calls Algeria the largest wine exporter of the 1950s. FAO records 8.7 mhl in 1970 and 2.8 in 1980. Its 2023 figure, about 109.7 thousand hectolitres, is imputed by FAO. Morocco (16th in 1961, 2.2 mhl) and Tunisia (20th, 1.4) are gone from the top twenty too.

From one Soviet Union to Russia, Georgia and Moldova
The Soviet Union was sixth in 1961 with 8.5 mhl. FAO's figures for it peak at 35.1 mhl in 1983 and fall to 15.7 mhl by 1990; FAO's last Soviet figure is for 1991. Its successors are counted separately now: Russia (4.8 mhl, 11th in 2023, an imputed figure), Moldova (1.3 mhl, 19th) and Georgia (1.2 mhl, 20th). Whether Georgia counts as European or Asian is a question of its own; here it sits with the Old World.
The United States: eighth to fourth
The United States made 6.4 mhl in 1961, 8th in the world. By 2000 FAO had it at 24.9 mhl, and it has outproduced Argentina in every FAO year since 1995. FAO has estimated or imputed every American figure since 2006, and its 20.8 mhl for 2023 looks low. A Wine Institute table compiled by the analysts Gomberg, Fredrikson & Associates shows about 28.9 mhl of still wine removed from fermenters that year. That is a different measure, but it sits just above FAO's Spanish figure and below the Spanish trade body's, so third place between the two is not settled.
Australia, South Africa and New Zealand: the southern climb
Three of the biggest risers are in the Southern Hemisphere. Australia was 19th in 1961 with 1.5 mhl; FAO has 8.1 mhl in 2000, a peak of 14.8 in 2021, and 9.6 in 2023, 7th in the world and its lowest since 2007. South Africa rose from 15th (3.1 mhl) to 8th (9.2). New Zealand made 43.2 thousand hectolitres in 1961, 33rd in the world, and 3.6 mhl in 2023, 14th.
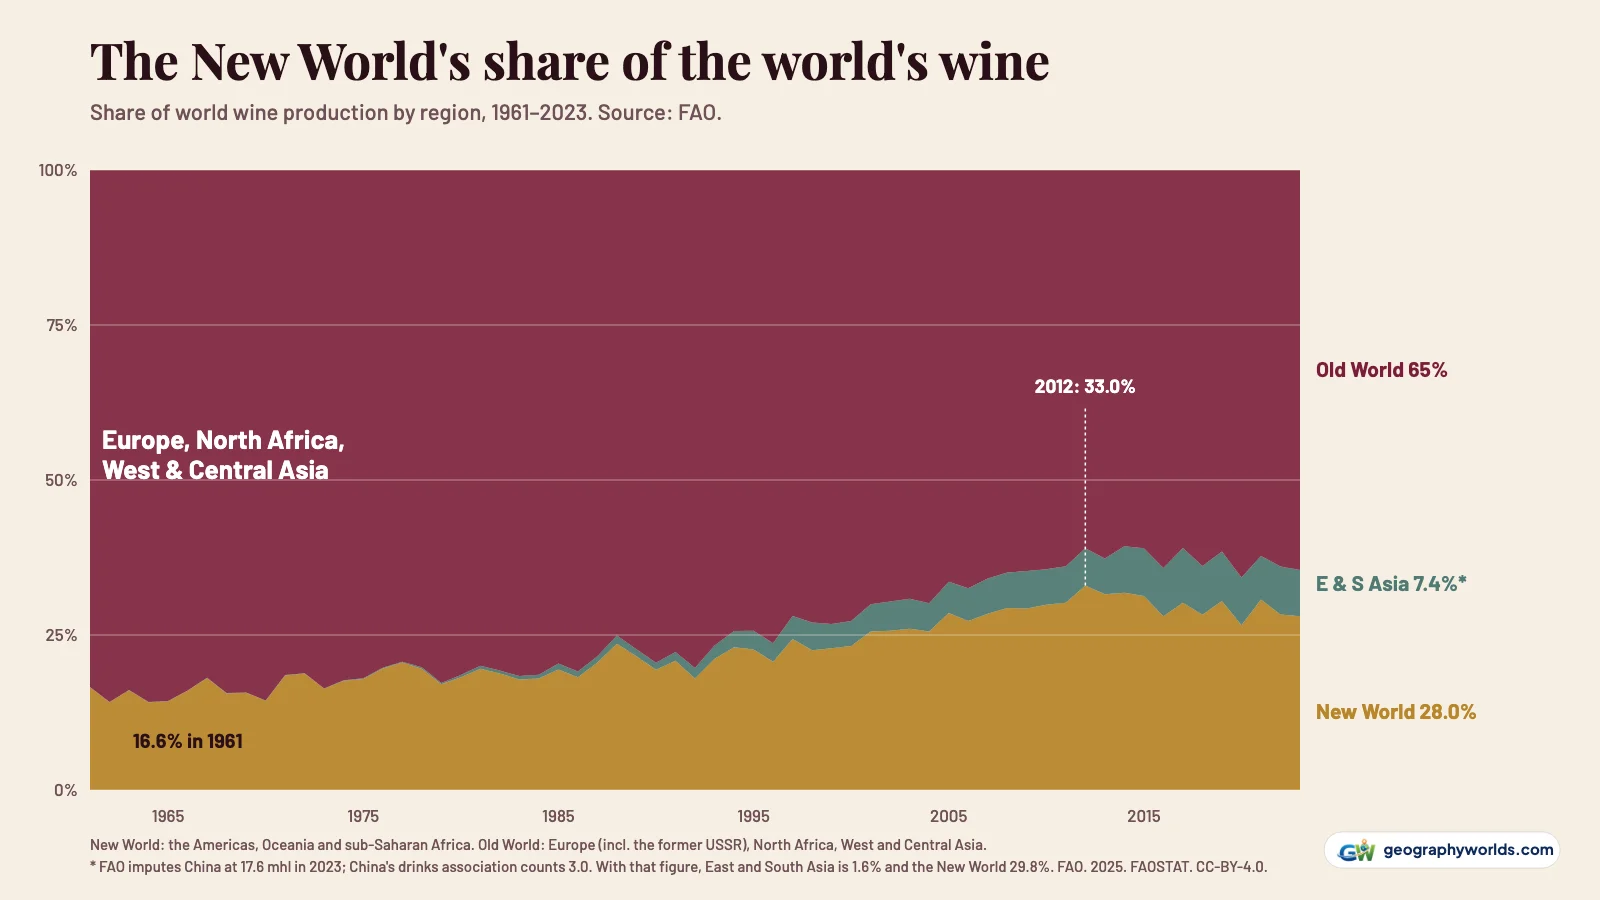
Group the countries by region and the shift is plain. In FAO's data the Americas, Oceania and sub-Saharan Africa, the "New World" of wine, made 16.6% of the world's wine in 1961. Their share peaked at 33.0% in 2012 and was 28.0% in 2023. Europe, North Africa and West and Central Asia, which made 83% in 1961, made 65% in 2023.
China: absent, then large on paper
China has no FAO wine figure for 1961 and only 0.8 mhl in 1980, also an estimate. Its fifth place in 2023 should be read with care. Every FAO figure for China since 2000 is an estimate or an imputation, and they peak at 22.3 mhl in 2018 before reaching 17.6 mhl in 2023. China's own counts are far smaller. The China Alcoholic Drinks Association put the whole industry at 300,000 kilolitres in 2023, or 3.0 mhl, a Ministry of Commerce market page reports, and the National Bureau of Statistics figure quoted by Zhiyan is 1.43 mhl. FAO's number is 5.9 times the association's. Swap the association's figure in and China falls to about 14th, the 2023 world total to about 230 mhl, the East Asian share from 7.4% to 1.6%, and the New World's rises to 29.8%.
2023: the smallest harvest since 1961
The world made 215 mhl of wine in 1961 by FAO's count (21.49 million tonnes) and 375 mhl at the series peak in 1979. Its 2023 total, 244 mhl, is the lowest of any year since 1961, though FAO marks that world figure as an estimate, down 32.0 mhl from 276 in 2022. Five countries account for 28.7 mhl of that fall: Italy (11.5), Spain (7.9), Australia (3.4), China (3.2) and Argentina (2.6). France, up 1.6, was the largest rise, ahead of Portugal. Italy's total was its lowest since 2014.
After 2023: national counts, not a ranking
FAO has no global figures after 2023, so nothing here ranks the 2024 or 2025 harvests. Some national statistics exist, and they suggest the order at the top has changed. Italy's statistics office, ISTAT, reports 48.0 mhl for 2024 and 47.8 for 2025. France's Agreste estimated about 36 mhl for 2025, according to a FranceAgriMer note. If those hold, Italy is ahead of France again. Spain's INFOVI system counted 28.9 mhl of wine in the first eight months of the 2025/26 season, Vinetur reports. Chile's agriculture service counted 9.3 mhl for 2024, down from 11.0, BioBioChile reported. These come from different systems with different definitions, so we have not ranked them.
The full table, then and now
| 2023 rank | Country | 2023 (mhl) | 2023 FAO status | 1961 rank | 1961 (mhl) |
|---|---|---|---|---|---|
| 1 | France | 47.6 | official | 2 | 48.6 |
| 2 | Italy | 42.5 | official | 1 | 52.5 |
| 3 | Spain | 28.5 | official | 3 | 20.2 |
| 4 | United States | 20.8 | imputed | 8 | 6.4 |
| 5 | China | 17.6 | imputed | – | – |
| 6 | Chile | 11.0 | official | 9 | 4.9 |
| 7 | Australia | 9.6 | external source | 19 | 1.5 |
| 8 | South Africa | 9.2 | external source | 15 | 3.1 |
| 9 | Argentina | 8.8 | official | 4 | 16.8 |
| 10 | Portugal | 7.4 | official | 7 | 7.4 |
| 11 | Russia | 4.8 | imputed | – | in USSR |
| 12 | Germany | 4.7 | imputed | 13 | 3.6 |
| 13 | Romania | 3.7 | external source | 10 | 4.4 |
| 14 | New Zealand | 3.6 | external source | 33 | 0.04 |
| 15 | Hungary | 2.9 | official | 14 | 3.5 |
| 16 | Brazil | 2.6 | official | 18 | 1.6 |
| 17 | Greece | 2.6 | official | 12 | 3.6 |
| 18 | Austria | 2.3 | official | 21 | 1.2 |
| 19 | Moldova | 1.3 | official | – | in USSR |
| 20 | Georgia | 1.2 | official | – | in USSR |
Tonnes, hectolitres and where the figures part
FAOSTAT reports wine in tonnes, but the figures behave as national hectolitre counts multiplied by 0.1. Its Italian figures are ISTAT's hectolitres divided by ten: 42.5 mhl for 2023. Chile's 2023 figure matches the 1.103 billion litres in the report above, Argentina's matches the 8.8 mhl from its national wine institute, and Australia's matches Wine Australia's 964 million litres. We convert back at that rate, so every hectolitre figure here is approximate.
FAO's table flags each figure, and the flags matter. France, Italy, Spain, Chile, Argentina and Portugal are official figures for 2023. The United States, China, Russia and Germany are imputed. Germany shows the risk: FAO's 4.7 mhl for 2023, 12th in the table, is far below the national count. The statistics office Destatis recorded 7.75 mhl of wine and must for 2024, 9.8% less than the year before, as Tageskarte reported, which implies about 8.6 mhl for 2023 and about 10th place. We have kept FAO's figures in the ranking so that one source sets every row, and flagged these rows instead.
The region groups are ours: the former Soviet Union counts as Old World, and Asian producers such as China and Japan form a third group. On the maps each circle sits at the centre of its country, except Russia and the Soviet Union, drawn in the south-west where most Russian vineyards are, and Yugoslavia and Czechoslovakia, at the centre of each former federation. The conversions, rankings and groupings on this page are ours, and FAO does not endorse them. You can download the data as a CSV: 85 countries, FAO tonnes for every year from 1961 to 2023, and FAO's 2023 data flag.
- FAO. 2025. FAOSTAT: Crops and livestock products. [Accessed on 4 November 2026]. https://www.fao.org/faostat/en/#data/QCL Licence: CC-BY-4.0.
- ISTAT, Coltivazioni: superfici e produzione (Italy's wine production in hectolitres): CC BY 4.0
- Natural Earth country outlines (via world-atlas): public domain
Where those vines grow, and why the same latitudes keep turning up, is the subject of our guide to the geography of the world's wine regions.