
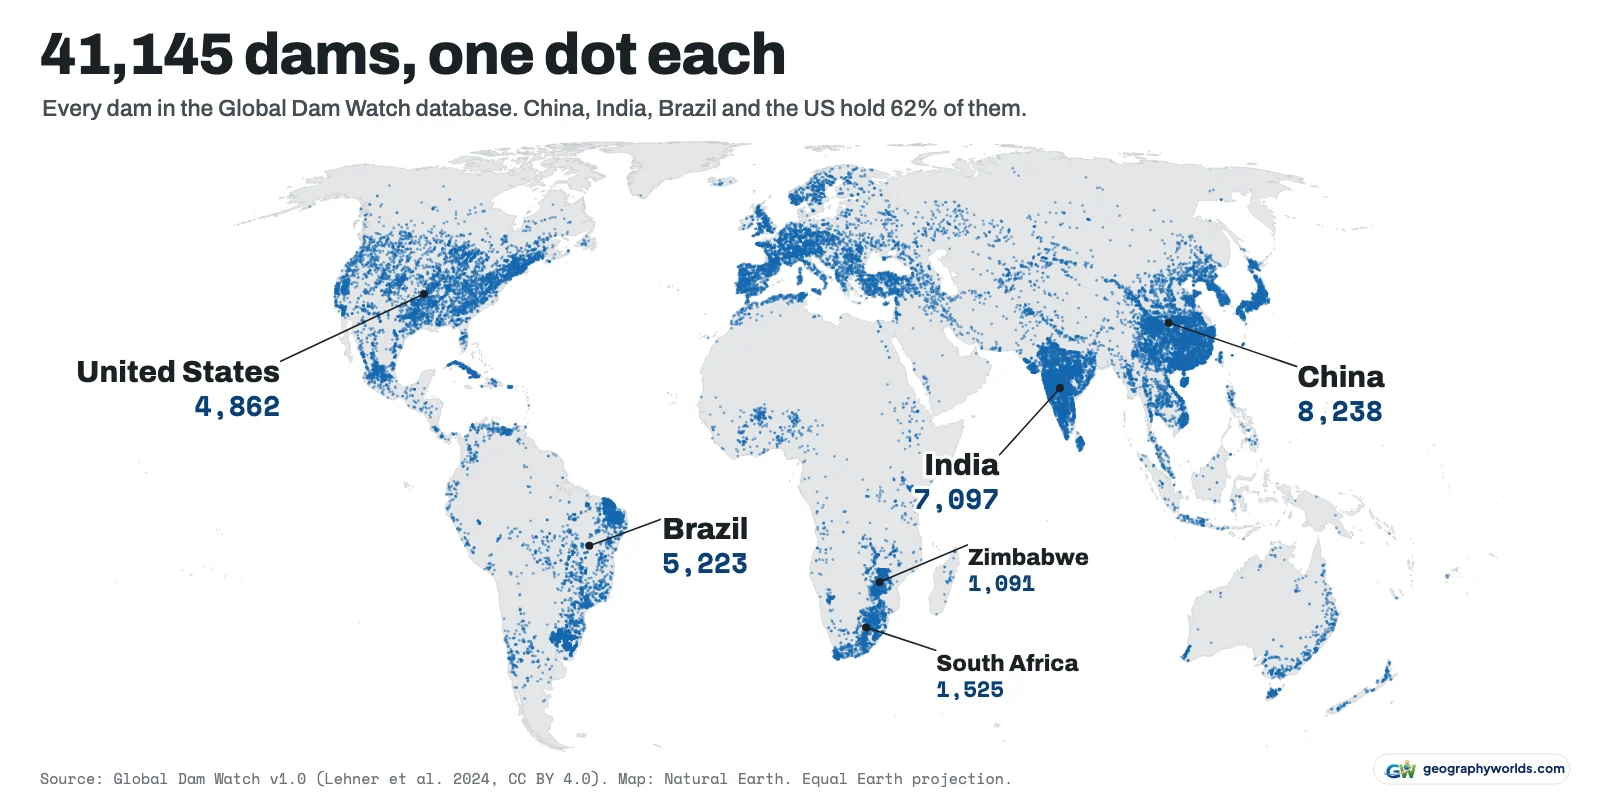
China has the most dams in the world. The International Commission on Large Dams (ICOLD) lists 24,217 Chinese dams among the 62,362 in its World Register (September 2025 edition), 39% of the total, followed by the United States (10,053), India (4,489), Japan (3,178) and Türkiye (1,923). In the Global Dam Watch database, which maps 41,145 dams and river barriers worldwide, China also comes first with 8,238, ahead of India (7,097), Brazil (5,223) and the United States (4,862). And China's own Ministry of Water Resources counted 94,300 reservoirs at the end of 2025, more than ICOLD registers on the entire planet.
None of those numbers is wrong. They count different things: dams tall enough to be classed as "large", dams pinned to a map, and every reservoir a government keeps on its books. China is first on both global lists, but most other countries move several places between them, so this piece takes the three numbers one at a time.
62,362: the register of large dams
ICOLD, the engineering body behind the standard definition, counts a dam as "large" if it is at least 15 metres high from its lowest foundation to its crest, or between 5 and 15 metres high and holding back more than 3 million cubic metres of water. Its World Register of Dams gathers data sent in by ICOLD's national committees, adds records from other public databases, and covers 166 countries. The September 2025 edition lists 62,362 dams with a combined reservoir storage of about 8,452 km³.
On this count China's lead is enormous. Its 24,217 large dams are 2.4 times the American total and 4,574 more than the next four countries put together. The United States is a clear second with 10,053, and India, Japan and Türkiye follow. Brazil is only ninth with 1,171, just behind South Africa (1,409).
The register is only as complete as the information ICOLD receives, and ICOLD warns that some data are missing. India shows the gap: its Central Water Commission lists 6,138 completed dams and 143 more under construction in its 2023 National Register of Large (Specified) Dams, well above the 4,489 in ICOLD's table. India uses its own test, from the Dam Safety Act, 2021: a dam above 15 metres, or one of 10 to 15 metres with a crest at least 500 metres long, a reservoir of at least 1 million m³, a flood discharge of at least 2,000 m³ per second, or a difficult foundation or unusual design. So part of the gap may be down to definitions.
41,145: the dams you can find on a map
The second number comes from Global Dam Watch (GDW), a database released in 2024 by a team led by Bernhard Lehner and described in Scientific Data. It merges research datasets that place each barrier at an exact location. The biggest source, GOODD, was built by people scanning Google Earth imagery one square degree at a time and marking dams whose reservoirs could be seen; it supplies 25,931 of the 41,145 records (63%). GRanD, a long-standing list of large reservoirs, adds 7,424, and GROD, drawn from satellite images of rivers wider than 30 metres, adds 6,113. The result is openly licensed (CC BY 4.0) and covers 165 countries and territories.
GDW does not filter by height. It includes 1,152 navigation locks and some low barriers, and its height field is filled in for only 9,311 records (23%). The authors note that small reservoirs on small and medium rivers are poorly covered by every global dataset. What GDW offers is location.
| GDW rank | Country | Dams mapped (GDW) | Share of world | ICOLD large dams | ICOLD rank | Dams per 10,000 km² | Province or state with most |
|---|---|---|---|---|---|---|---|
| 1 | China | 8,238 | 20.0% | 24,217 | 1 | 8.8 | Hubei (981) |
| 2 | India | 7,097 | 17.2% | 4,489 | 3 | 23.9 | Maharashtra (1,997) |
| 3 | Brazil | 5,223 | 12.7% | 1,171 | 9 | 6.2 | Rio Grande do Sul (1,801) |
| 4 | United States | 4,862 | 11.8% | 10,053 | 2 | 5.3 | Texas (438) |
| 5 | South Africa | 1,525 | 3.7% | 1,409 | 8 | 12.6 | Free State (282) |
| 6 | Zimbabwe | 1,091 | 2.7% | 274 | 20 | 28.2 | Mashonaland West (306) |
| 7 | Japan | 855 | 2.1% | 3,178 | 4 | 23.5 | Hokkaido (112) |
| 8 | France | 827 | 2.0% | 725 | 13 | 15.3 | Occitanie (178) |
| 9 | Türkiye | 715 | 1.7% | 1,923 | 5 | 9.3 | Sivas (36) |
| 10 | Mexico | 632 | 1.5% | 1,106 | 10 | 3.3 | Jalisco (81) |
| 11 | Spain | 578 | 1.4% | 1,054 | 11 | 11.6 | Andalucía (113) |
| 12 | Australia | 563 | 1.4% | 730 | 12 | 0.7 | New South Wales (138) |
| 13 | Vietnam | 558 | 1.4% | 136 | 36 | 17.8 | Đắk Lắk (100) |
| 14 | Canada | 450 | 1.1% | 1,430 | 7 | 0.5 | Québec (129) |
| 15 | Germany | 413 | 1.0% | 399 | 17 | 11.8 | Bayern (150) |
China still comes first, with 8,238 dams, about 20% of the records. The rest of the order changes sharply. India rises to second with 7,097, and Brazil jumps from ninth to third with 5,223. The United States falls to fourth with 4,862. South Africa (1,525) and Zimbabwe (1,091) take fifth and sixth, and Zimbabwe, 20th in ICOLD's register with 274, ends up with more mapped dams than Japan (855) or Canada (450). Taken together, China, India, Brazil and the United States hold 62% of the dots.
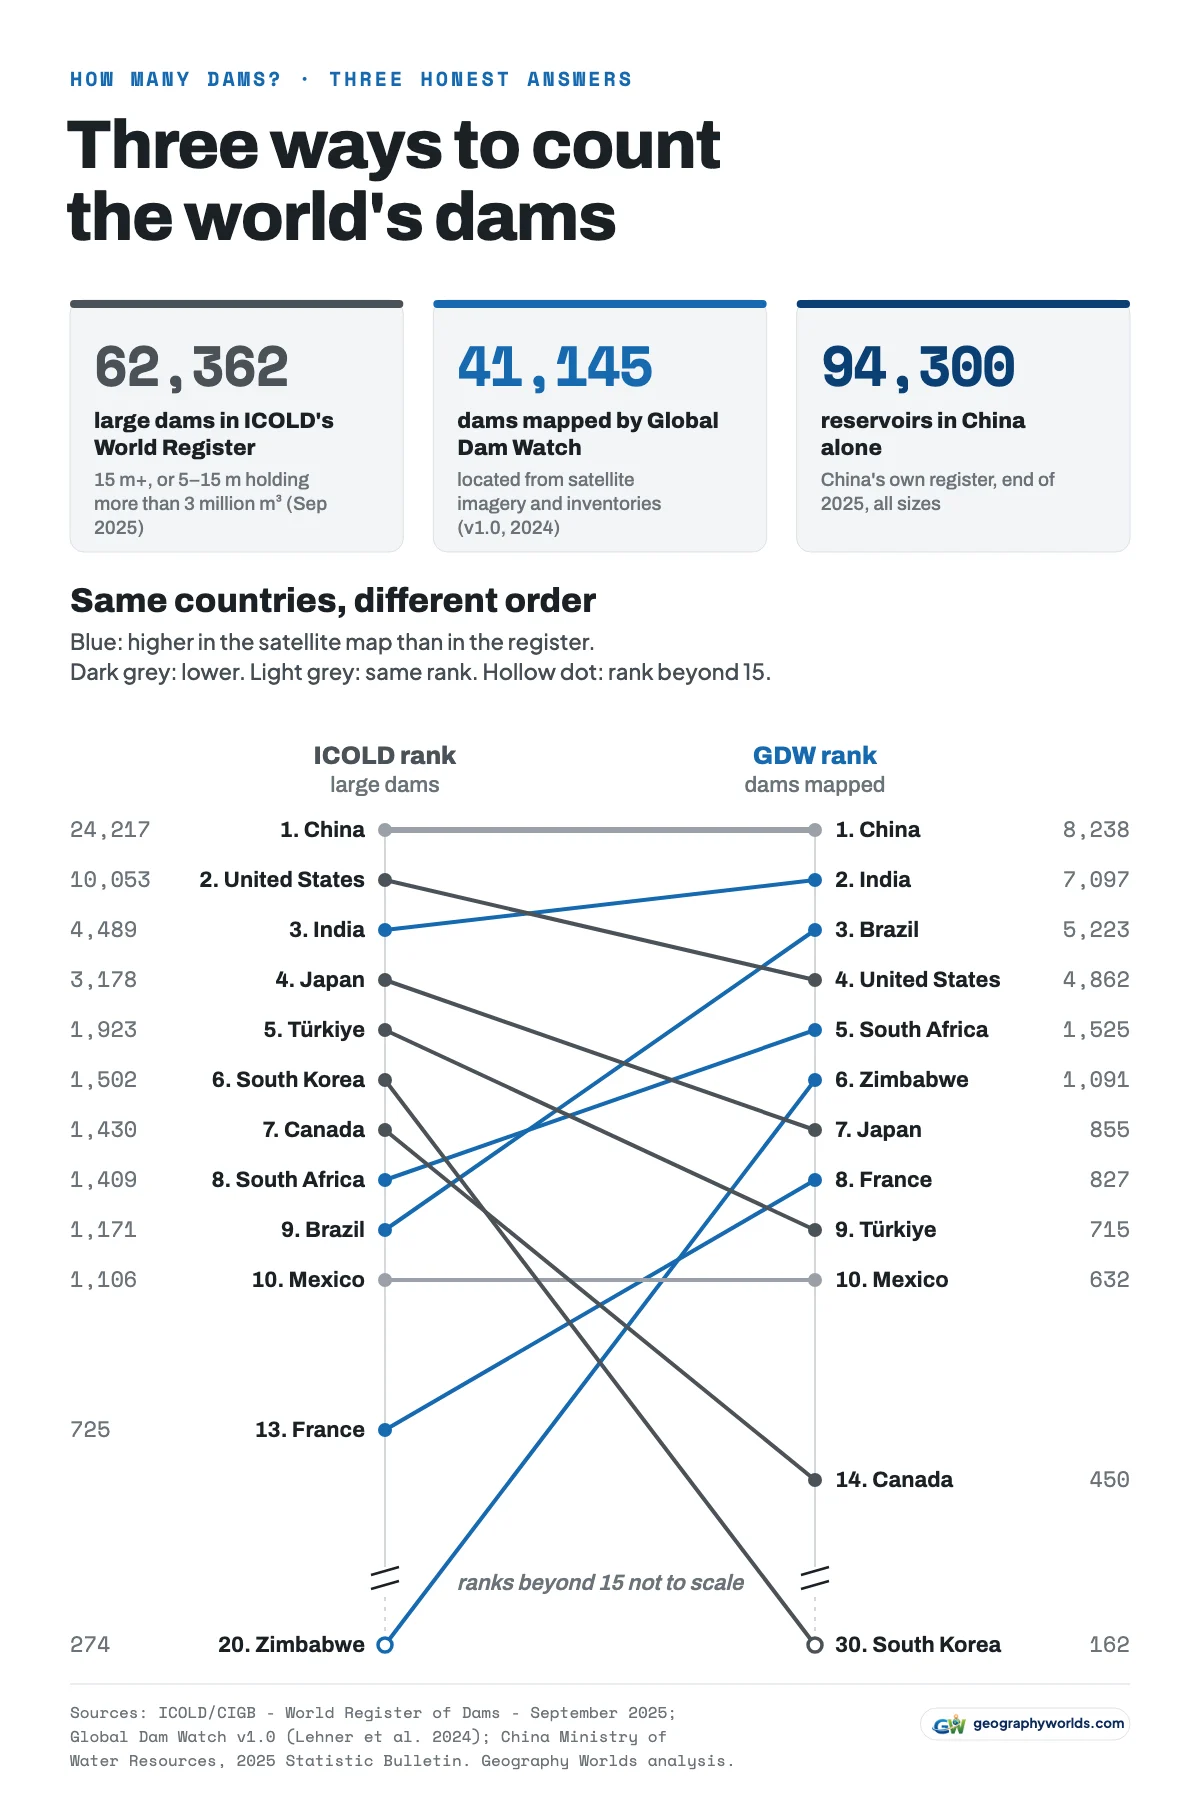
The jumps follow the method. In India 81% of the mapped dams and in Brazil 89% come from GOODD's imagery search, which records dams at least 150 metres long with a reservoir at least 500 metres long visible on the imagery, whatever their height. In the United States only 50% do; most American records come from GRanD and from matches to the national inventory. The difference shows in what is known about each dam: GDW has a height for 88% of the US records, but for only 5% of India's and 4% of Brazil's. So the ranking says as much about how each country was mapped as about its dams.
Where the dots crowd together
GDW records each dam's province or state. Maharashtra in western India has 1,997 dams on the map, more than any other province or state in the world. Brazil's southernmost state, Rio Grande do Sul, has 1,801, and Ceará in the dry north-east has 1,557. Each of those three has more mapped dams than South Africa, the fifth country in the ranking. Next come Karnataka (1,138) and China's Hubei (981). India's own register agrees on the leader: it puts 2,333 of the country's completed large dams in Maharashtra, more than in any other state.

Ceará's reservoirs are known locally as açudes. GDW dates the Cedro dam above to 1906 and gives it a height of 20 metres, tall enough to count as large under ICOLD's definition, though for most of the state's mapped dams GDW records no height at all.
Per area of land, the picture changes again. Among the 40 countries with at least 100 mapped dams, Zimbabwe has the most for its size: 28.2 per 10,000 km², using World Bank land areas for 2024. Sri Lanka, Cuba and Switzerland follow, and India has 23.9. China has 8.8 and the United States 5.3. Zimbabwe's best-known structure is the Kariba Dam, shared with Zambia on the Zambezi, but the density comes from more than a thousand reservoirs across the country, 90% of them found by GOODD's imagery search. That is why Zimbabwe has 4.0 times as many dams in GDW as in ICOLD's register.
94,300: what China counts at home
The third number comes from the country at the top of every list. China's 2025 Statistic Bulletin on China Water Activities, published by the Ministry of Water Resources in July 2026, reports 94,300 reservoirs built across the country at the end of 2025. Only 852 of them are classed as large and 4,278 as medium; the other 89,170 (95%) are small reservoirs. That is 3.9 times the number of Chinese dams in ICOLD's register and 11 times the number in GDW.
The figure is also falling. The same bulletin gives 98,566 reservoirs for 2020, so China has 4,266 fewer than five years earlier, and it reports that more than 4,000 reservoirs have been downgraded or decommissioned since the start of the 14th Five-Year Plan in 2021. Building has continued at the large end, the class that includes the Three Gorges Dam on the Yangtze: large reservoirs rose from 774 in 2020 to 852 in 2025. The total is shrinking from the bottom.
The United States keeps a similar national list. The US Army Corps of Engineers' National Inventory of Dams lists 92,694 dams, roughly 9.2 times the American figure in ICOLD's register and 19 times the American dots in GDW. The inventory takes in every dam classed as high hazard (a failure would probably cost lives) or significant hazard, plus any dam at least 25 feet (7.6 m) high holding more than 15 acre-feet, or more than 6 feet high holding at least 50 acre-feet, according to the inventory's own description. Those thresholds sit far below ICOLD's 15 metres, and 46,494 of the listed dams (50%) are under 25 feet tall.
China's 94,300 and America's 92,694 are not the same measure, though: one counts reservoirs and the other dams, a reservoir can sit behind several dams, and the minimum sizes differ. What both show is far more dams than any global list records.
Which number to use
For one ranking of countries, use ICOLD's single definition of a large dam. To see where dams are, or to reuse the data freely, use Global Dam Watch. For every structure in one country, use its own register. China leads both global counts; India, Brazil and Zimbabwe can look like major dam countries or minor ones depending on the list.
For the map and table we counted every GDW 1.0 record under the country GDW assigns it. Eight territories, among them Puerto Rico and Greenland, stay in the data but out of the ranking, leaving 157 countries ranked. ICOLD's figures are quoted from its public summary pages with the credit line ICOLD asks for: ICOLD/CIGB - World Register of Dams/Registre Mondial des Barrages - September 2025. You can download the data as a CSV with each country's count, density and busiest province; if a table is not how you like to read numbers, Parity can draw your own charts from that file in a few clicks. ICOLD's figures are not in the CSV because the register is copyrighted.
- Lehner et al. (2024), Global Dam Watch database version 1.0, figshare, doi:10.6084/m9.figshare.25988293: 41,145 river barriers with coordinates, country and province. CC BY 4.0 (as stated on the figshare record). Described in Scientific Data 11 (2024).
- Lehner et al. (2024), The Global Dam Watch database of river barrier and reservoir information for large-scale applications, Scientific Data: How GDW was assembled from GRanD, GOODD, GROD and other sources, and what it leaves out. Open access.
- ICOLD/CIGB - World Register of Dams/Registre Mondial des Barrages - September 2025: number of dams by country and general synthesis: Public summary pages of the World Register; figures quoted with ICOLD's required credit line. Not redistributed in our CSV.
- Ministry of Water Resources of China, 2025 Statistic Bulletin on China Water Activities (2025年全国水利发展统计公报), July 2026: National count of reservoirs at the end of 2025 and for 2020–2024.
- US Army Corps of Engineers, National Inventory of Dams: national summary: Count of every US dam meeting the federal inclusion criteria, with height and hazard breakdowns, read from the NID's public summary API on 9 October 2026. US government work, public domain.
- Central Water Commission, National Register of Large (Specified) Dams 2023 (summary on India Environment Portal): India's national count of completed and under-construction large dams.
- World Bank, Land area (sq. km), indicator AG.LND.TOTL.K2: Used for dams per 10,000 km². CC BY 4.0.
- Natural Earth land and countries, 1:50m, via the world-atlas package: Public domain. Background map only.
A count says nothing about size, and the ranking looks completely different sorted by height, as our guide to the tallest dams in the world shows.