
China has the most glaciers of any country: 48,535 of the 216,330 glaciers in the World Glacier Monitoring Service list, or 22% of the total. Ranked by number, the leaders are China, Canada, United States, Greenland's peripheral glaciers and India. Ranked by how much ice they cover, the order changes: Canada comes first with 184,600 km², about 26% of all glacier area outside the two ice sheets, followed by Greenland's peripheral glaciers, the United States, Russia and China.
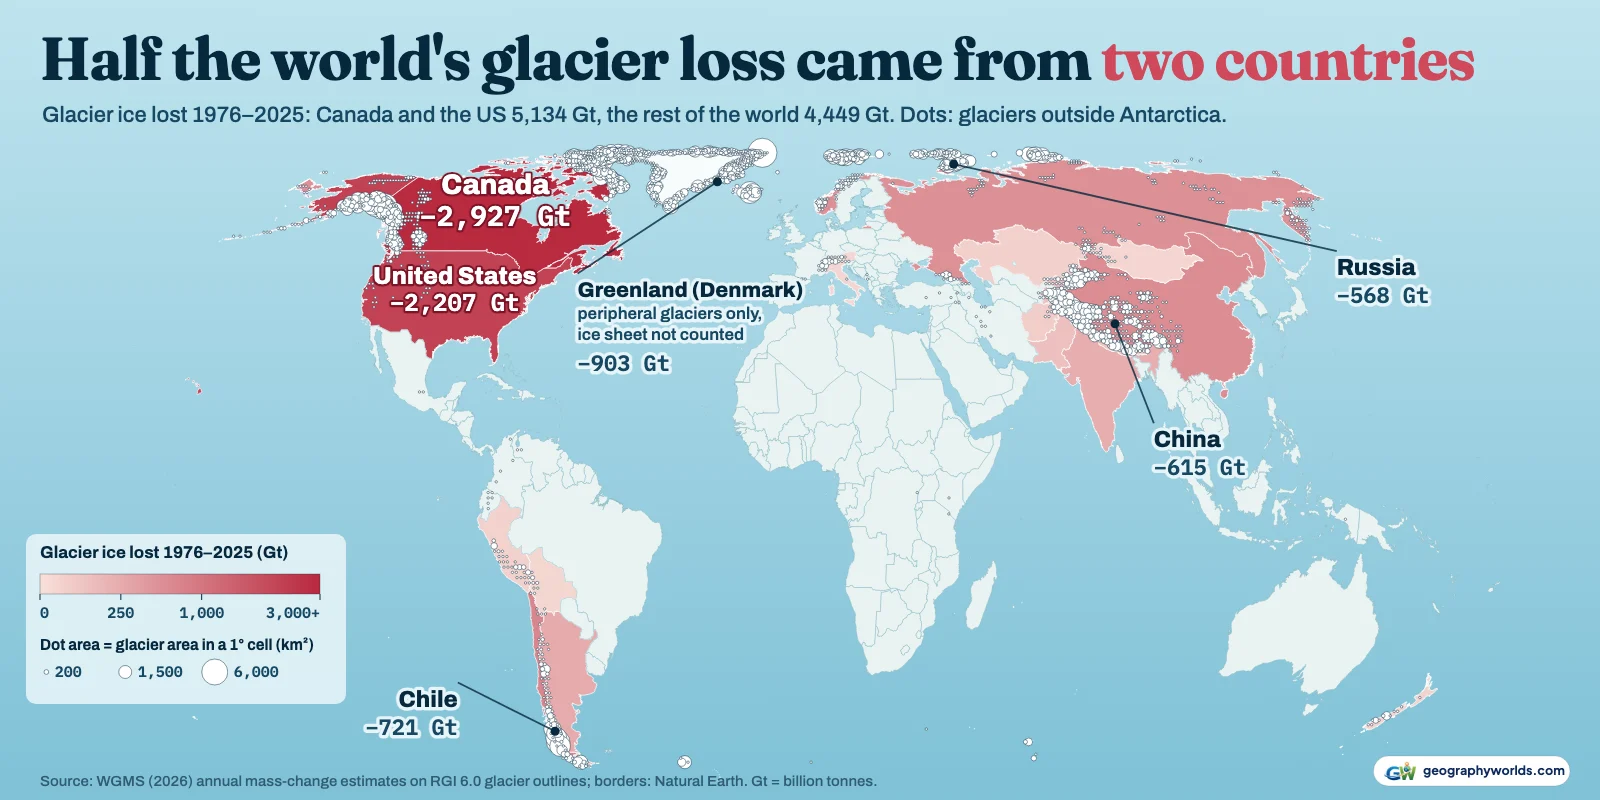
Both rankings come from the WGMS, which publishes a mass-change series for every glacier in its list, built on the Randolph Glacier Inventory (RGI) 6.0. We placed each glacier in a country and added up the yearly changes. The result is a country-by-country account of glacier ice from 1976 to 2025, and its most striking line is this: Canada and the United States together lost 5,134 billion tonnes (gigatonnes, Gt) of glacier ice in those fifty years. That is 54% of the 9,583 Gt the world's glaciers lost, from two countries that hold 35% of the glacier area. Over 2000–2025, when satellite data are far denser, their share is 48%.
The top 15, glacier by glacier
The table counts glaciers as the inventory draws them, so a big ice cap split by ridges into many outlet glaciers counts as many glaciers. China's glaciers average 1.0 km² each: tens of thousands of small valley and cirque glaciers spread across the Tibetan Plateau, the Kunlun, the Tian Shan and the north side of the Himalaya. Canada's average 5.5 km², because so much of its ice sits in large Arctic ice caps. Russia is the extreme case, with only 6,505 glaciers but 54,318 km² of ice, most of it on Arctic islands.
| # | Country or territory | Glaciers | Area (km²) | Rank by area | Share of world glacier area | Average size (km²) | Main glacier region |
|---|---|---|---|---|---|---|---|
| 1 | China | 48,535 | 47,724 | 5 | 6.8% | 0.98 | Central Asia |
| 2 | Canada | 33,423 | 184,600 | 1 | 26.1% | 5.52 | Arctic Canada North |
| 3 | United States | 24,532 | 63,620 | 3 | 9.0% | 2.59 | Alaska |
| 4 | Greenland (Denmark), peripheral glaciers only | 19,307 | 89,719 | 2 | 12.7% | 4.65 | Greenland periphery |
| 5 | India | 11,808 | 13,571 | 9 | 1.9% | 1.15 | South Asia West |
| 6 | Chile | 11,711 | 24,567 | 7 | 3.5% | 2.10 | Patagonian Andes |
| 7 | Pakistan | 9,890 | 13,964 | 8 | 2.0% | 1.41 | South Asia West |
| 8 | Tajikistan | 8,690 | 7,722 | 11 | 1.1% | 0.89 | Central Asia |
| 9 | Kyrgyzstan | 7,460 | 6,008 | 12 | 0.8% | 0.81 | Central Asia |
| 10 | Russia | 6,505 | 54,318 | 4 | 7.7% | 8.35 | Russian Arctic |
| 11 | Norway | 4,779 | 36,702 | 6 | 5.2% | 7.68 | Svalbard and Jan Mayen |
| 12 | Argentina | 4,287 | 5,004 | 13 | 0.7% | 1.17 | Patagonian Andes |
| 13 | Afghanistan | 3,968 | 2,472 | 16 | 0.3% | 0.62 | South Asia West |
| 14 | New Zealand | 3,537 | 1,162 | 18 | 0.2% | 0.33 | New Zealand |
| 15 | Nepal | 3,142 | 3,120 | 14 | 0.4% | 0.99 | South Asia East |
Greenland appears as a territory of Denmark, and its figures cover only the 19,307 glaciers and ice caps around the edge of the island (89,719 km²), not the Greenland Ice Sheet, which the inventory treats separately. Antarctica's 2,015 peripheral glaciers (129,363 km²) are in the downloadable data but not the ranking.
Why High Mountain Asia wins the count
Five of the top nine countries by number sit on the mountain systems that radiate from the Pamir knot: China, India (11,808 glaciers), Pakistan (9,890), Tajikistan (8,690) and Kyrgyzstan (7,460). Steep relief breaks their ice into many separate tongues, so the count climbs fast while the area stays modest. Pakistan's 9,890 glaciers in the WGMS list cover 13,964 km² (a newer national inventory by the University of Milan for EvK2CNR and UNDP counts 13,032); Canada has 3.4 times as many glaciers but more than 13 times the ice-covered ground.
We used Natural Earth's de facto lines, which put each part of Kashmir with the country that administers it. Natural Earth draws the Siachen Glacier area as its own disputed unit, and its 156 glaciers (1,317 km²) are kept out of both India's and Pakistan's totals. Most of Pakistan's ice is in the Karakoram, a range we return to below.
Where the ice actually is: the Arctic rim
By area, the glacier world is an Arctic one. 57% of Canada's glacier area lies in the Queen Elizabeth Islands of the far north, the region the WGMS calls Arctic Canada North, with the rest on Baffin and Bylot islands, in the Yukon's Saint Elias Mountains and along the Coast Mountains of British Columbia. Norway's 36,702 km² is almost all on Svalbard rather than the mainland. Russia's ice is overwhelmingly on Novaya Zemlya, Severnaya Zemlya and Franz Josef Land: the Russian Arctic region accounts for 95% of the country's glacier area. Iceland, with only 568 glaciers, still covers 11,060 km², an average of 19 km² per glacier, because Vatnajökull and its neighbours are ice caps. For the individual giants, see our guide to the largest glaciers in the world.
Fifty years of loss, and the two countries behind half of it
The WGMS series starts in 1976. Since then the world's glaciers have lost 9,583 Gt of ice, enough to raise global sea level by 26.4 mm, and 7,658 Gt of that has gone since 2000.
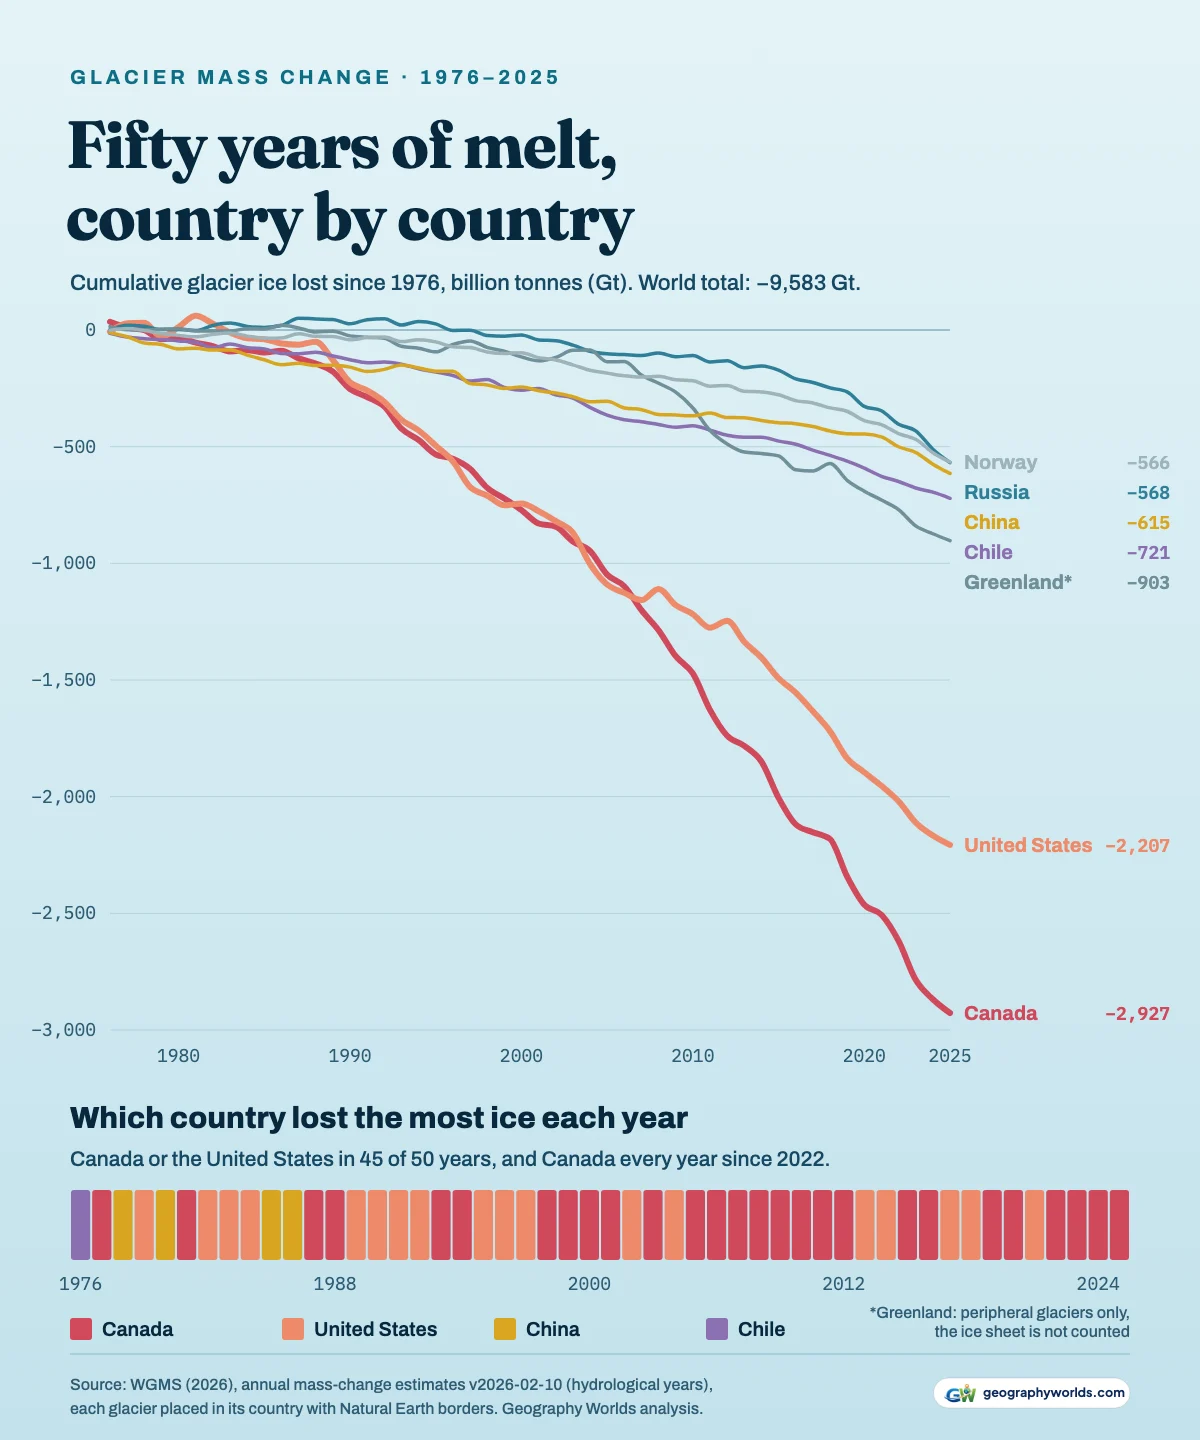
Canada lost 2,927 Gt over the fifty years and the United States 2,207 Gt. The next biggest totals are far smaller: Greenland's peripheral glaciers 903 Gt, Chile 721 Gt, China 615 Gt, Russia 568 Gt and Norway 566 Gt. Canada on its own accounts for 31% of the world's loss.
Two things put North America so far ahead. The first is Alaska and the Yukon, where large glaciers reach down close to sea level in a maritime climate, so a warm summer melts ice over a big area at low altitude. American glaciers have thinned by 34.7 metres of water equivalent on average since 1976, more than in any other of the five largest glacier countries. The WGMS region called Alaska crosses the border, and Canada holds 28% of its glacier area in the Yukon and northern British Columbia. The second is the sheer size of the Canadian Arctic ice. The independent GlaMBIE community estimate (2025) agrees: for 2000–2023 it found Alaska (22%) and the Canadian Arctic (20%) the two largest regional contributors to glacier loss.
In 45 of the 50 years in the series, either Canada or the United States lost more glacier ice than any other country; in a few years the two were a near-tie. Canada has topped the list in every year since 2022. Its loss of 167 Gt in 2023 is the largest one-year loss by any country in the record, in the same year the world's glaciers had their worst year, losing 555 Gt.
2025: Canada first, Russia close behind
The WGMS put the world's glacier loss in the 2025 hydrological year at 408 Gt, about 1.1 mm of sea-level rise, in its summary of the year, which was last updated in April 2026. That was less than the 461 Gt lost in 2024, but it still ranks 6th largest in the fifty-year series. The summary names Western Canada and the USA, Iceland and Central Europe as the regions that lost the most ice relative to their size, and High Mountain Asia, Alaska and the Russian Arctic as the biggest contributors in absolute terms.
Summed by country, Canada lost 59 Gt in 2025, 14% of the world total, and Russia lost 57 Gt. The United States, Norway and China each lost about 40 Gt. The gap between Canada and Russia is well inside the uncertainty: the WGMS gives the Russian Arctic region alone a 2025 loss of 55.5 Gt with a one-sigma uncertainty of 19 Gt. Russia was also close behind in 2024, losing 78 Gt to Canada's 83 Gt.
Russia's rise is the trend worth watching. From 1976 to 1985 its glaciers were roughly stable, with an average gain of 1.1 Gt a year. Over 2016 to 2025 they lost an average of 40 Gt a year, and 95% of Russia's fifty-year loss (541 of 568 Gt) has happened since 2000.
Thinning hardest: Patagonia, the Alps, and one exception
Total tonnes favour big countries. Dividing each country's loss since 2000 by its glacier area gives the average thinning, in metres of water equivalent.
Argentina (28.0 m) and the French Southern Lands' Kerguelen ice cap (27.7 m) lead, and which is first depends on how offshore tidewater glaciers are assigned. 64% of Argentina's glacier area is in the Patagonian Andes, where big outlet glaciers on the eastern side of the Southern Patagonian Ice Field (see our guide to the glaciers of Patagonia) end in lakes and lose ice at their fronts as well as their surfaces; Chile, on the wetter western side of the same ice, thinned by 19.3 m. The Alpine countries follow: Switzerland 24.3 m, with Austria, Italy and France close behind.
At the other end of the scale is Pakistan. Of the ten countries with the most glacier area, it thinned the least since 2000, by 3.5 m; Argentina's glaciers thinned 8 times as much. Glaciologists call this the Karakoram anomaly: in the central Karakoram, glaciers held roughly steady for decades while ice almost everywhere else shrank. There are signs it is fading. Pakistan's glaciers lost 12.3 Gt in 2025, the 2nd largest loss in its fifty-year series, and the WGMS ranks the South Asia West region among those with the biggest negative anomalies of 2025. China (7.6 m), Greenland's peripheral glaciers (9.0 m) and Canada (11.9 m) also thinned far less than the leaders.
How the numbers were built
All the mass-change figures come from the WGMS annual mass-change estimates (version 2026-02-10), which combine satellite measurements of glacier elevation change with field measurements on reference glaciers. Years are hydrological years: in the Northern Hemisphere, 2025 means October 2024 to September 2025. The glacier list is built on RGI 6.0, whose outlines date mostly from around 2000, and their areas add up to 707,013 km². RGI 6.0 itself counts 215,547 glaciers; the WGMS list differs slightly, for example using 2014 outlines for the Caucasus. Years before 2000 rest on sparser observations, and Dussaillant and colleagues (2025) give them wider uncertainty.
Each glacier was assigned to the country containing its centre point on Natural Earth's 1:10m map. 1,901 tidewater and island glaciers whose centre point fell just offshore were matched to the nearest coastline within 60 km, and 11 could not be matched. The WGMS regional totals are not exactly the area-weighted sum of their glaciers, differing by up to about a tenth of a metre of water equivalent a year in some regions, so we spread that small remainder across countries by area. Glacier counts depend on how an inventory splits ice complexes, and the newer RGI 7.0 draws some regions differently, so read the counts as approximate. You can download the data as a CSV; if you would rather chart it than read it, Parity turns a CSV into finished charts.
- WGMS (2026): Annual mass-change estimates for the world's glaciers, version 2026-02-10 (doi:10.5904/wgms-amce-2026-02-10): Per-glacier outlines (RGI 6.0 centre points and areas) and annual mass change, hydrological years 1976–2025. Open access under the requirement of correct citation.
- Dussaillant et al. (2025), Annual mass change of the world's glaciers from 1976 to 2024, Earth System Science Data 17: 1977–2006: The method behind the WGMS series. Open access, CC BY 4.0.
- WGMS: Glaciers in 2025 (summary page; published in Nature Reviews Earth & Environment 7: 213–215, 2026): WGMS summary of the 2025 hydrological year, updated 15 April 2026.
- Natural Earth admin-0 countries, 1:10m, via the world-atlas package: Public domain. De facto boundaries, used to place each glacier's centre point in a country.
The numbers show glaciers shrinking almost everywhere, but they began as snow that never melted, and our explainer on how glaciers are formed follows that process from fresh snow to flowing ice.