
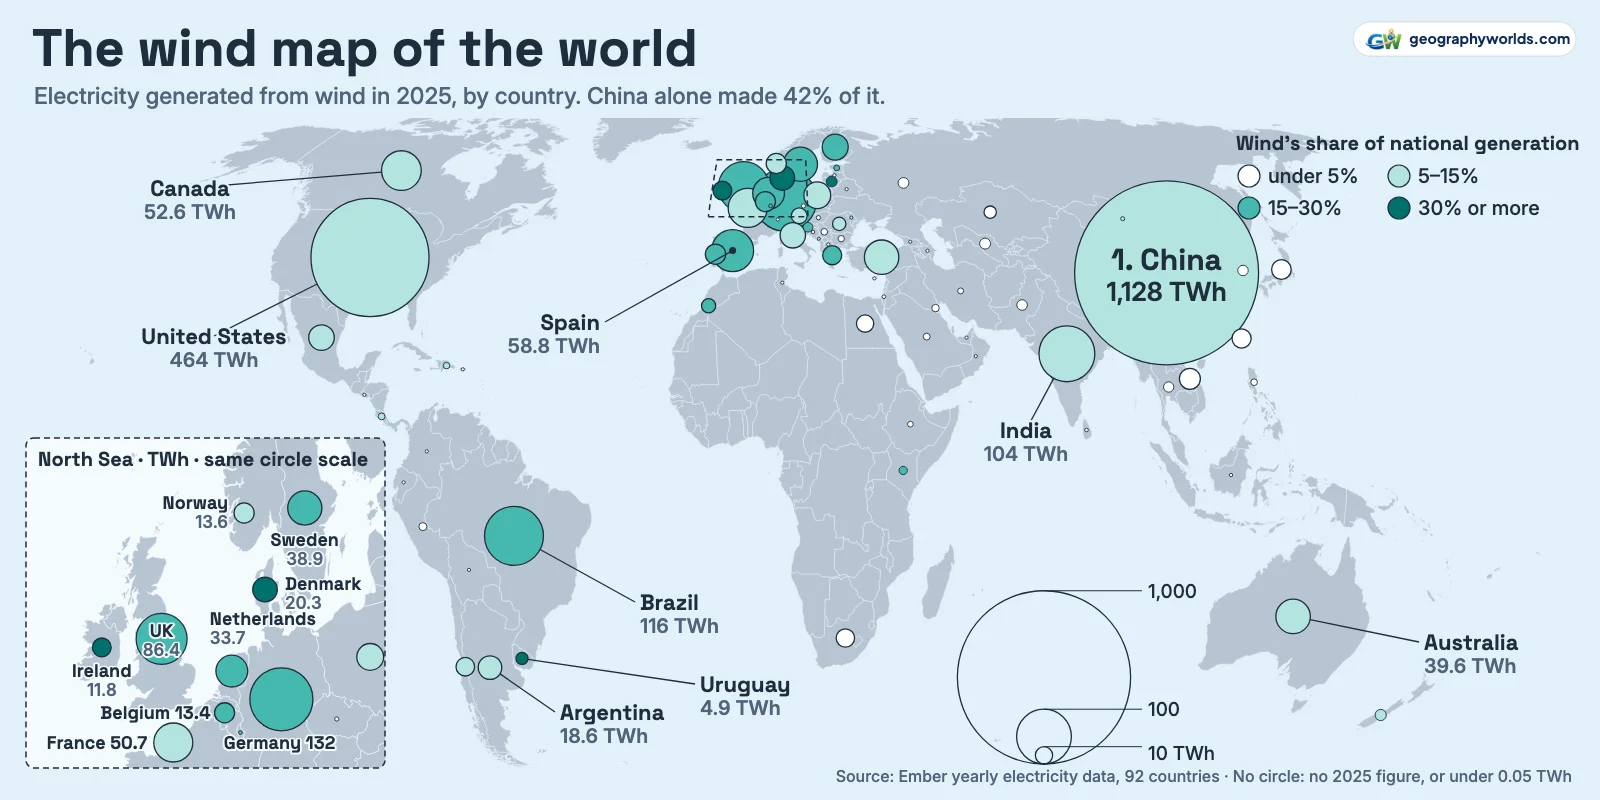
China has the most wind power of any country. It generated about 1,128 terawatt-hours (TWh) of wind electricity in 2025, some 42% of the world's 2,705 TWh, followed by the United States (464 TWh), Germany (132 TWh), Brazil (116 TWh) and India (104 TWh), according to Ember's yearly electricity data. China also leads on installed capacity, with 641 gigawatts (GW). Ranked by wind's share of national generation the list changes completely: Denmark comes first at 56.9%, then Lithuania (45.0%), Uruguay (40.5% on Ember's figures, though its own energy ministry says 34%, which would be fourth behind Ireland) and Ireland (37.3%).
On the map above, each circle's area is one country's wind generation in 2025, on a single scale across the world and the North Sea panel, and its colour shows wind's share of national generation. The tops of the two lists do not overlap at all, because they measure different things. The first rewards size, the second rewards a small grid with few other sources, and neither says how windy a place is. So it helps to sort the 92 countries in Ember's 2025 data into three kinds: the giants, the small grids with the highest wind shares, and the stretches of sea and steppe where geography does the work.
The giants: five countries, 72% of the world's wind electricity
Wind supplied 8.5% of the world's electricity in 2025. China alone out-generated the next 9 countries put together, which summed to 1,105 TWh. Its increase in that single year, 131 TWh, was 66% of the world's growth and more than the UK's entire output. The lead is recent: since 2000, Germany was the largest producer until 2007, the United States from 2008 to 2015, and China from 2016 onwards.
| Rank | Country | Wind generation 2025 (TWh) | Change on 2024 | Share of national generation | Capacity end-2025 (GW) |
|---|---|---|---|---|---|
| 1 | China | 1,128 | +13% | 10.7% | 640.6 |
| 2 | United States | 464 | +3% | 10.3% | 158.8 |
| 3 | Germany | 132 | −4% | 26.6% | 77.8 |
| 4 | Brazil | 116 | +8% | 15.2% | 34.9 |
| 5 | India | 104 | +28% | 5.0% | 54.5 |
| 6 | United Kingdom | 86.4 | +3% | 29.4% | 33.4 |
| 7 | Spain | 58.8 | −5% | 20.4% | 33.3 |
| 8 | Canada | 52.6 | +10% | 8.0% | 17.7 |
| 9 | France | 50.7 | +6% | 8.8% | 25.7 |
| 10 | Australia | 39.6 | +20% | 13.8% | 16.4 |
| 11 | Türkiye | 39.4 | +8% | 11.1% | 14.8 |
| 12 | Sweden | 38.9 | −4% | 22.8% | 17.4 |
| 13 | Netherlands | 33.7 | +1% | 25.0% | 11.8 |
| 14 | Poland | 24.0 | −7% | 13.9% | 10.6 |
| 15 | Finland | 22.6 | +11% | 27.4% | 9.4 |
China's total needs a note. The National Bureau of Statistics counts 1,053 TWh, but that series covers only plants above a designated size, compiled here by province, while Ember's figure is for all plants. On the same bureau's numbers, Inner Mongolia made 203 TWh by itself. That one region out-produced every country except China and the United States. If the European Union counted as a single country, which it does not in this ranking, its 480 TWh would sit between China and the US, at 17.1% of its electricity.
The other giants each have a particular geography. In the United States, Texas, Iowa, Oklahoma, Kansas and Illinois made about 52% of the country's wind electricity in 2025, along the windy interior of the Great Plains and the Midwest. In Brazil, the Northeast subsystem produced 93% of output, with Bahia at 40.8 TWh and Rio Grande do Norte at 30.7 TWh, says the industry association ABEEólica. That concentration has a cost: roughly a fifth of Brazil's wind and solar output was curtailed in 2025, according to Volt Robotics, because the grid could not always take it.
Germany's 132 TWh fell 4% on 2024 in a year of weaker wind, and Destatis reports a matching 131.3 billion kWh fed into the grid. India moved the other way, up 28% to overtake the UK for fifth place. The US Energy Information Administration's explainer page still lists the UK fifth for 2025, but India's reported 104,007 GWh and the UK's official 86.4 TWh both agree with Ember.
Capacity, measured in GW, is a separate question from generation, and it reorders this group. India has 54.5 GW installed against Brazil's 34.9 GW, yet Brazil generated more. Germany has more than twice Brazil's capacity and made only slightly more electricity. A gigawatt on paper does not produce a fixed amount of power, and the third section below shows how much the difference can be.
Small grids with the highest wind shares
Share of national generation needs one rule: here a country must generate at least 5 TWh in all to rank, which 88 of the 92 do. Without a floor, a single wind farm can decide the result. Luxembourg shows the problem. Wind made 29.9% of what it generated, but it generated only 1.6 TWh and used 6.5 TWh, so it stays outside the ranking.
| Rank | Country | Share of generation | Wind output as % of demand | Wind (TWh) | All generation (TWh) |
|---|---|---|---|---|---|
| 1 | Denmark | 56.9% | 47.1% | 20.3 | 35.6 |
| 2 | Lithuania | 45.0% | 32.0% | 4.0 | 8.8 |
| 3 | Uruguay* | 40.5% | 35.5% | 4.9 | 12.0 |
| 4 | Ireland | 37.3% | 31.2% | 11.8 | 31.6 |
| 5 | United Kingdom | 29.4% | 27.7% | 86.4 | 293.7 |
| 6 | Finland | 27.4% | 25.7% | 22.6 | 82.5 |
| 7 | Portugal | 26.8% | 22.7% | 13.7 | 51.1 |
| 8 | Germany | 26.6% | 25.6% | 132.3 | 497.0 |
| 9 | Netherlands | 25.0% | 27.9% | 33.7 | 135.0 |
| 10 | Sweden | 22.8% | 28.5% | 38.9 | 170.2 |
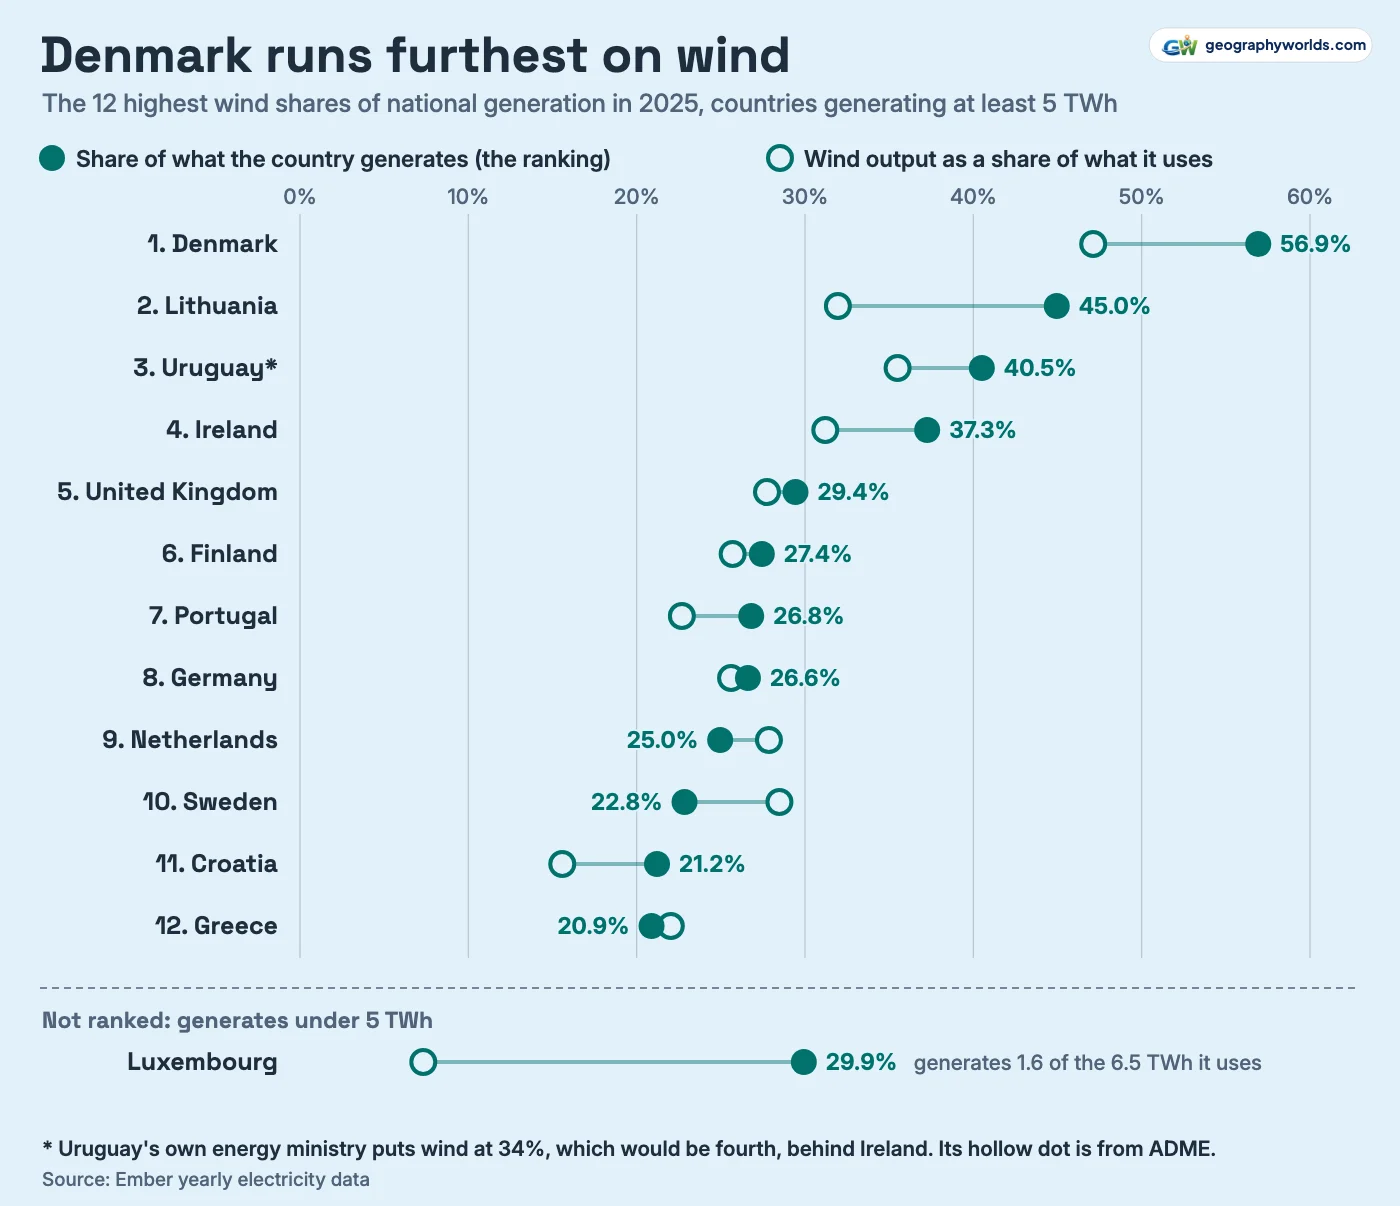
Denmark has been at this longest. Wind was already 11.8% of its generation in 2000, and the world's first offshore wind farm opened at Vindeby in 1991, with 11 turbines of 450 kW each. Sources disagree on the exact number for 2025 but not on the result. Ember has 20.3 TWh and 56.9%. The Danish grid operator Energinet reports about 19 TWh and 60% of domestic production. Energinet also says production fell short of consumption in every month of 2025, so as a share of what Danes used the figure is lower: 47.1% on Ember's numbers, and 50% according to Lithuania's grid operator Litgrid, which ranks Denmark first in Europe on that measure.

Lithuania shows why the denominator matters most. Wind was 45.0% of what it generated, up from 4.4% in 2010, but the country generated only 8.8 TWh and used 12.4 TWh. Measured against consumption wind drops to 32.0% on Ember's data and 33% on Litgrid's. The base matters in Germany too: Destatis puts wind at 30.0% of grid feed-in, which would rank fifth. Net exporters move the other way: wind counts for more against what Sweden and the Netherlands consume (28.5% and 27.9%) than against what they generate, because part of their power is sold abroad.
Uruguay is where this list is least certain. Wind went from 0.7% of its electricity in 2010 to 40.4% in 2020, and Ember gives 40.5% for 2025. But the energy ministry puts wind at 34% of 13,040 GWh, which would be fourth, behind Ireland. Ember differs from the market operator ADME on wind (4.9 against about 4.4 TWh), hydro (3.3 against about 5.9 TWh) and trade: ADME shows a net exporter, with exports of 1,019 GWh and imports of 630 GWh, and wind at about 35.5% of demand. This ranking keeps one source for every country, so Uruguay stays third with that warning attached. Ireland's figure is steadier: 37.3% of generation and 31.2% of demand, close to the third of the island's electricity reported by Wind Energy Ireland, whose report also cites EirGrid data showing 13% of wind energy never reached consumers because of grid limits.
Where geography does the work: the North Sea, Patagonia and Gansu
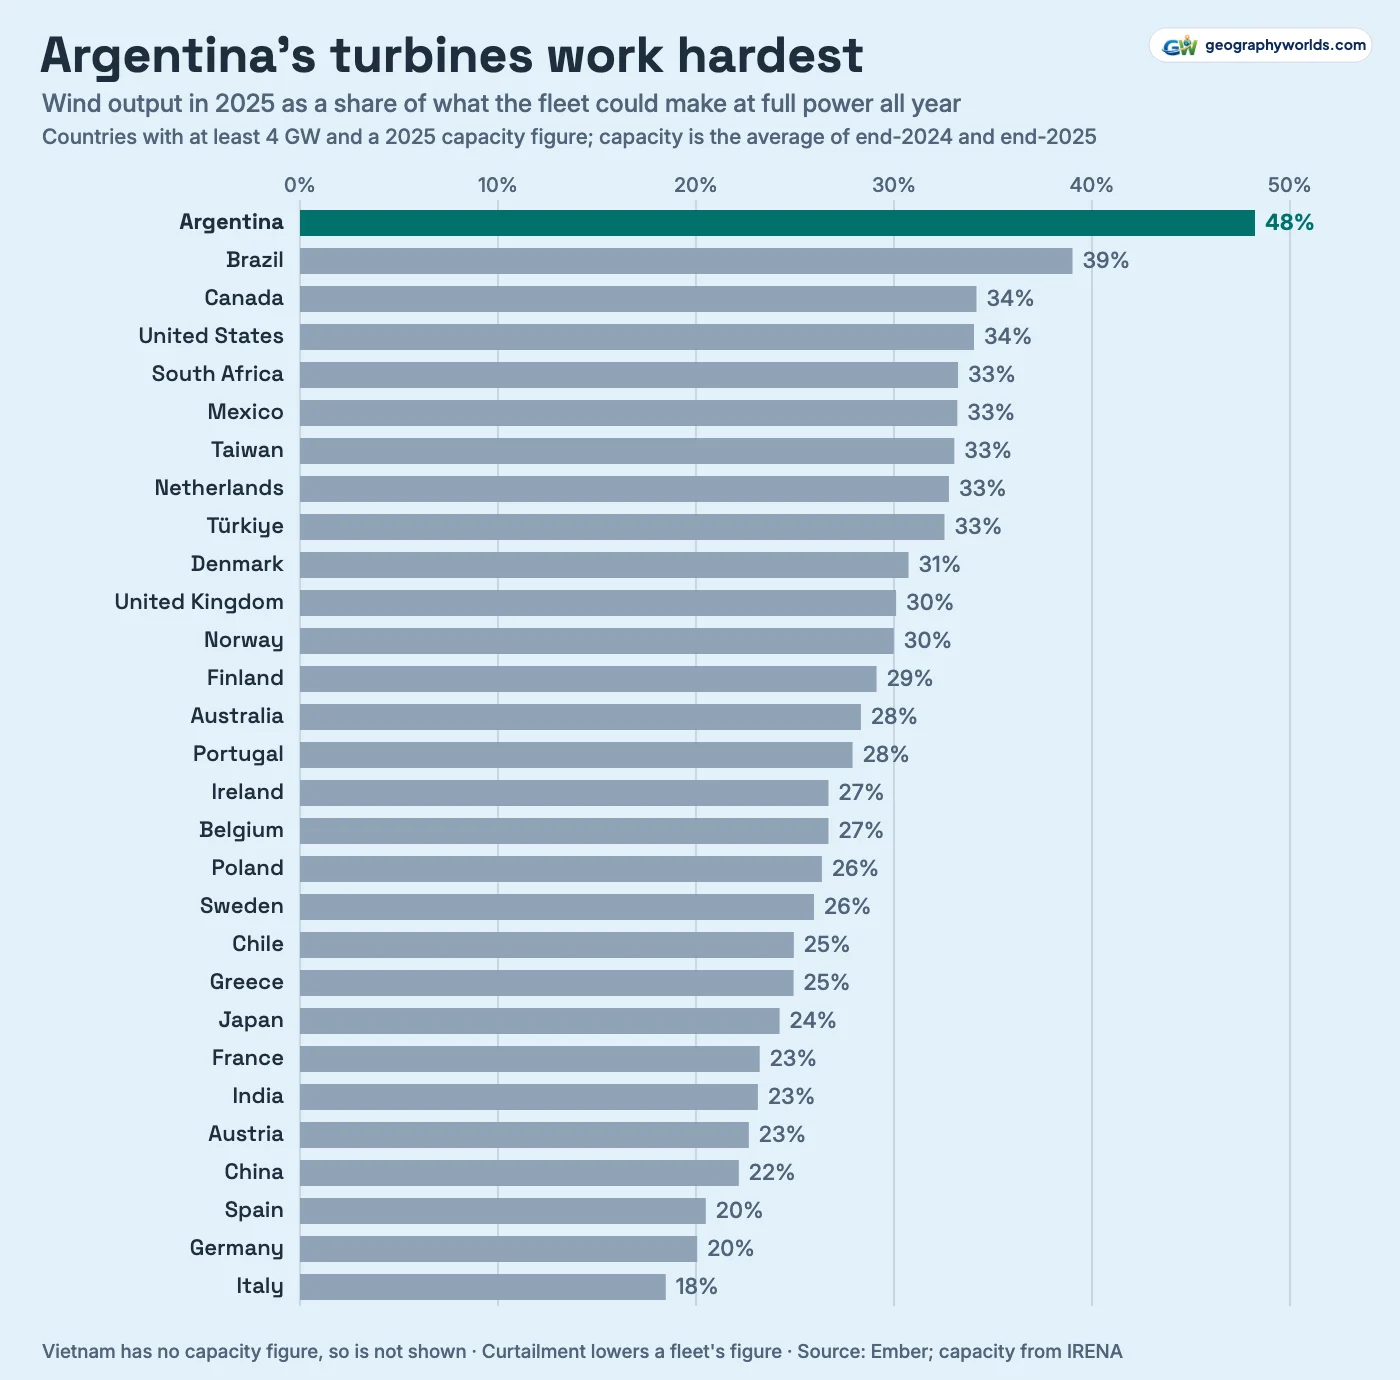
The best measure of a windy place is how hard its turbines run. Dividing 2025 generation by what the average fleet could have produced at full power gives a capacity factor. For the 29 countries with a reported capacity of at least 4 GW, this is our own calculation from Ember's file, and it runs from 48% in Argentina to 18% in Italy. It is a rough one: weak years and curtailment both pull it down, and fleets that grew fast late in the year look worse than they are. Germany's 20% and China's 22% partly reflect that. The method does land close to official figures, though: 30% for the UK, between the 24.1% onshore and 36.4% offshore in DUKES, and 39% for Brazil against ABEEólica's 37%.
The North Sea's advantage is a shallow seabed in a windy place. The Dogger Bank, a sandbank about 100 kilometres off England, gives its name to the wind farm now being added to the UK's grid. UK offshore wind reached a record 52 TWh in 2025, 60% of the country's wind output, against 34.4 TWh onshore. Nine governments signed a declaration at Ostend in April 2023 setting targets of about 120 GW in the North Seas by 2030 and at least 300 GW by 2050. For all that, the world's biggest offshore fleet is no longer in Europe: China had 47.4 GW at the end of 2025, more than Europe's 38.6 GW combined and just over half of the world's 91.4 GW.
Patagonia is the extreme case on land. It lies in the Roaring Forties and beyond, where westerlies blow between 40° and 50° south with little land to slow them down. Argentina's national fleet of about 4.4 GW, with 28 of its 68 wind farms in the south at the end of 2024, made 18.6 TWh, an implied 48%, the highest of the 29. Single sites go higher: Manantiales Behr in Chubut averaged 58.4% in 2024 to late December, on the grid operator CAMMESA's records as reported by Diario Río Negro. Yet Argentina is only 19th by generation. Geography sets what each turbine can do, not how many get built.

Gansu is the opposite lesson. The Gansu wind complex near Jiuquan, started in 2009 in the Gobi desert with a 20 GW goal, sits a very long way from the cities that need its power. The province had 32.1 GW of wind by the end of 2024, according to its statistical bulletin, nearly as much as the UK's entire 33.4 GW a year later. The problem was getting the electricity out. In 2016 Gansu threw away 43% of its potential wind output, the worst of the regions singled out that year. A 2,383 km direct-current line to Hunan opened in 2017 to help carry it east.
How the rankings were counted
All generation and share figures come from Ember's file of 3 November 2026 for calendar year 2025, onshore and offshore together. Regions never rank as countries. Shares are of national generation unless stated. Capacity is IRENA's, as carried in Ember's file; Vietnam has none listed there, so it is absent from the capacity comparisons. About two dozen smaller systems with 2024 data, among them Jordan and Nicaragua, have no 2025 figure, and none could reach the tables above. You can download the data as a CSV, with all 92 countries and their demand, capacity and capacity factors; if a table is not enough, Parity can turn that spreadsheet into a chart of your own.
Sources:
- Ember, Yearly electricity data (release_generation_yearly_global.csv): File dated 3 November 2026. Wind generation (TWh), share of generation (%), demand and capacity (GW) by country; 2025 covers 92 countries. Capacity comes from IRENA. Licence as stated by Ember: Creative Commons Attribution (CC-BY-4.0).
- IRENA, Renewable Capacity Statistics 2026: © IRENA 2026. Offshore wind capacity by country at the end of 2025.
- National figures: US EIA, Destatis, DUKES 2026, Energinet, Litgrid, Uruguay's MIEM and ADME, ABEEólica, China's NEA and NBS: Used to check Ember's figures; most are linked where they appear in the text.
- Natural Earth country boundaries via world-atlas (1:50m): Public domain. Used for the map.
Wind is only one part of the wider picture, so see where it sits beside hydro and sunshine in our ranking of the countries with the most renewable energy, compare it with the countries generating the most solar power, or go looking for the raw resource itself among the windiest places in the world.